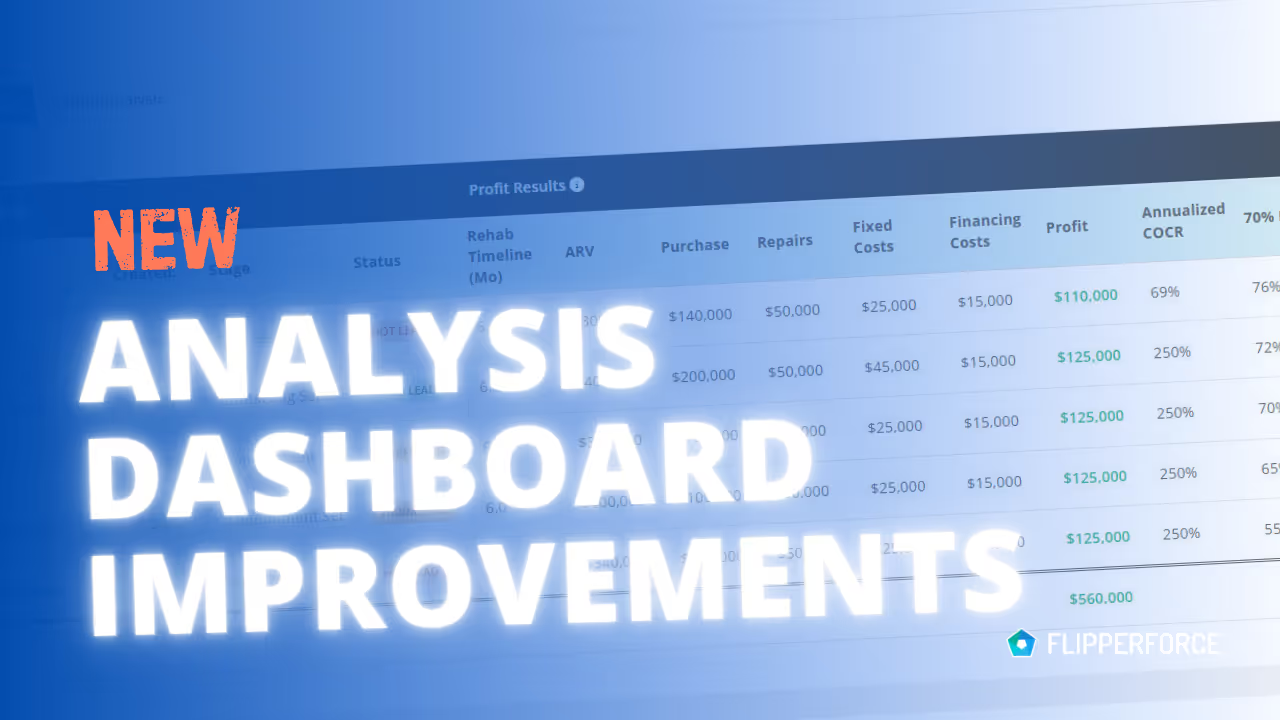
The Analysis Dashboard gives you a portfolio-level view of every deal you've run through the Flip Analyzer. It's the fastest way to compare your analyzed deals, track underwriting trends, and make smarter acquisition decisions based on your own data history.
The Analysis Dashboard pulls all of your saved Flip Analyzer deals into a central view, displaying key metrics like purchase price, estimated ARV, projected profit, and ROI side by side across your deal pipeline.
Access the Analysis Dashboard from the main navigation. Review the summary cards at the top for totals across your analyzed deal pipeline, then drill into the table below to sort and compare individual deals by any metric. Click any deal to open its full Flip Analyzer results.
Most investors analyze deals in isolation. The Analysis Dashboard lets you step back and see the bigger picture — identifying patterns in your deal flow, comparing market opportunities, and keeping your acquisition criteria sharp across every property you've evaluated.