House Flipping Statistics 2026: Benchmarks From Real Investor Deals.
House flipping statistics from 25,119 real fix-and-flip deals: closing costs, selling costs, rehab cost per sq ft, profit margins, and budget overruns.
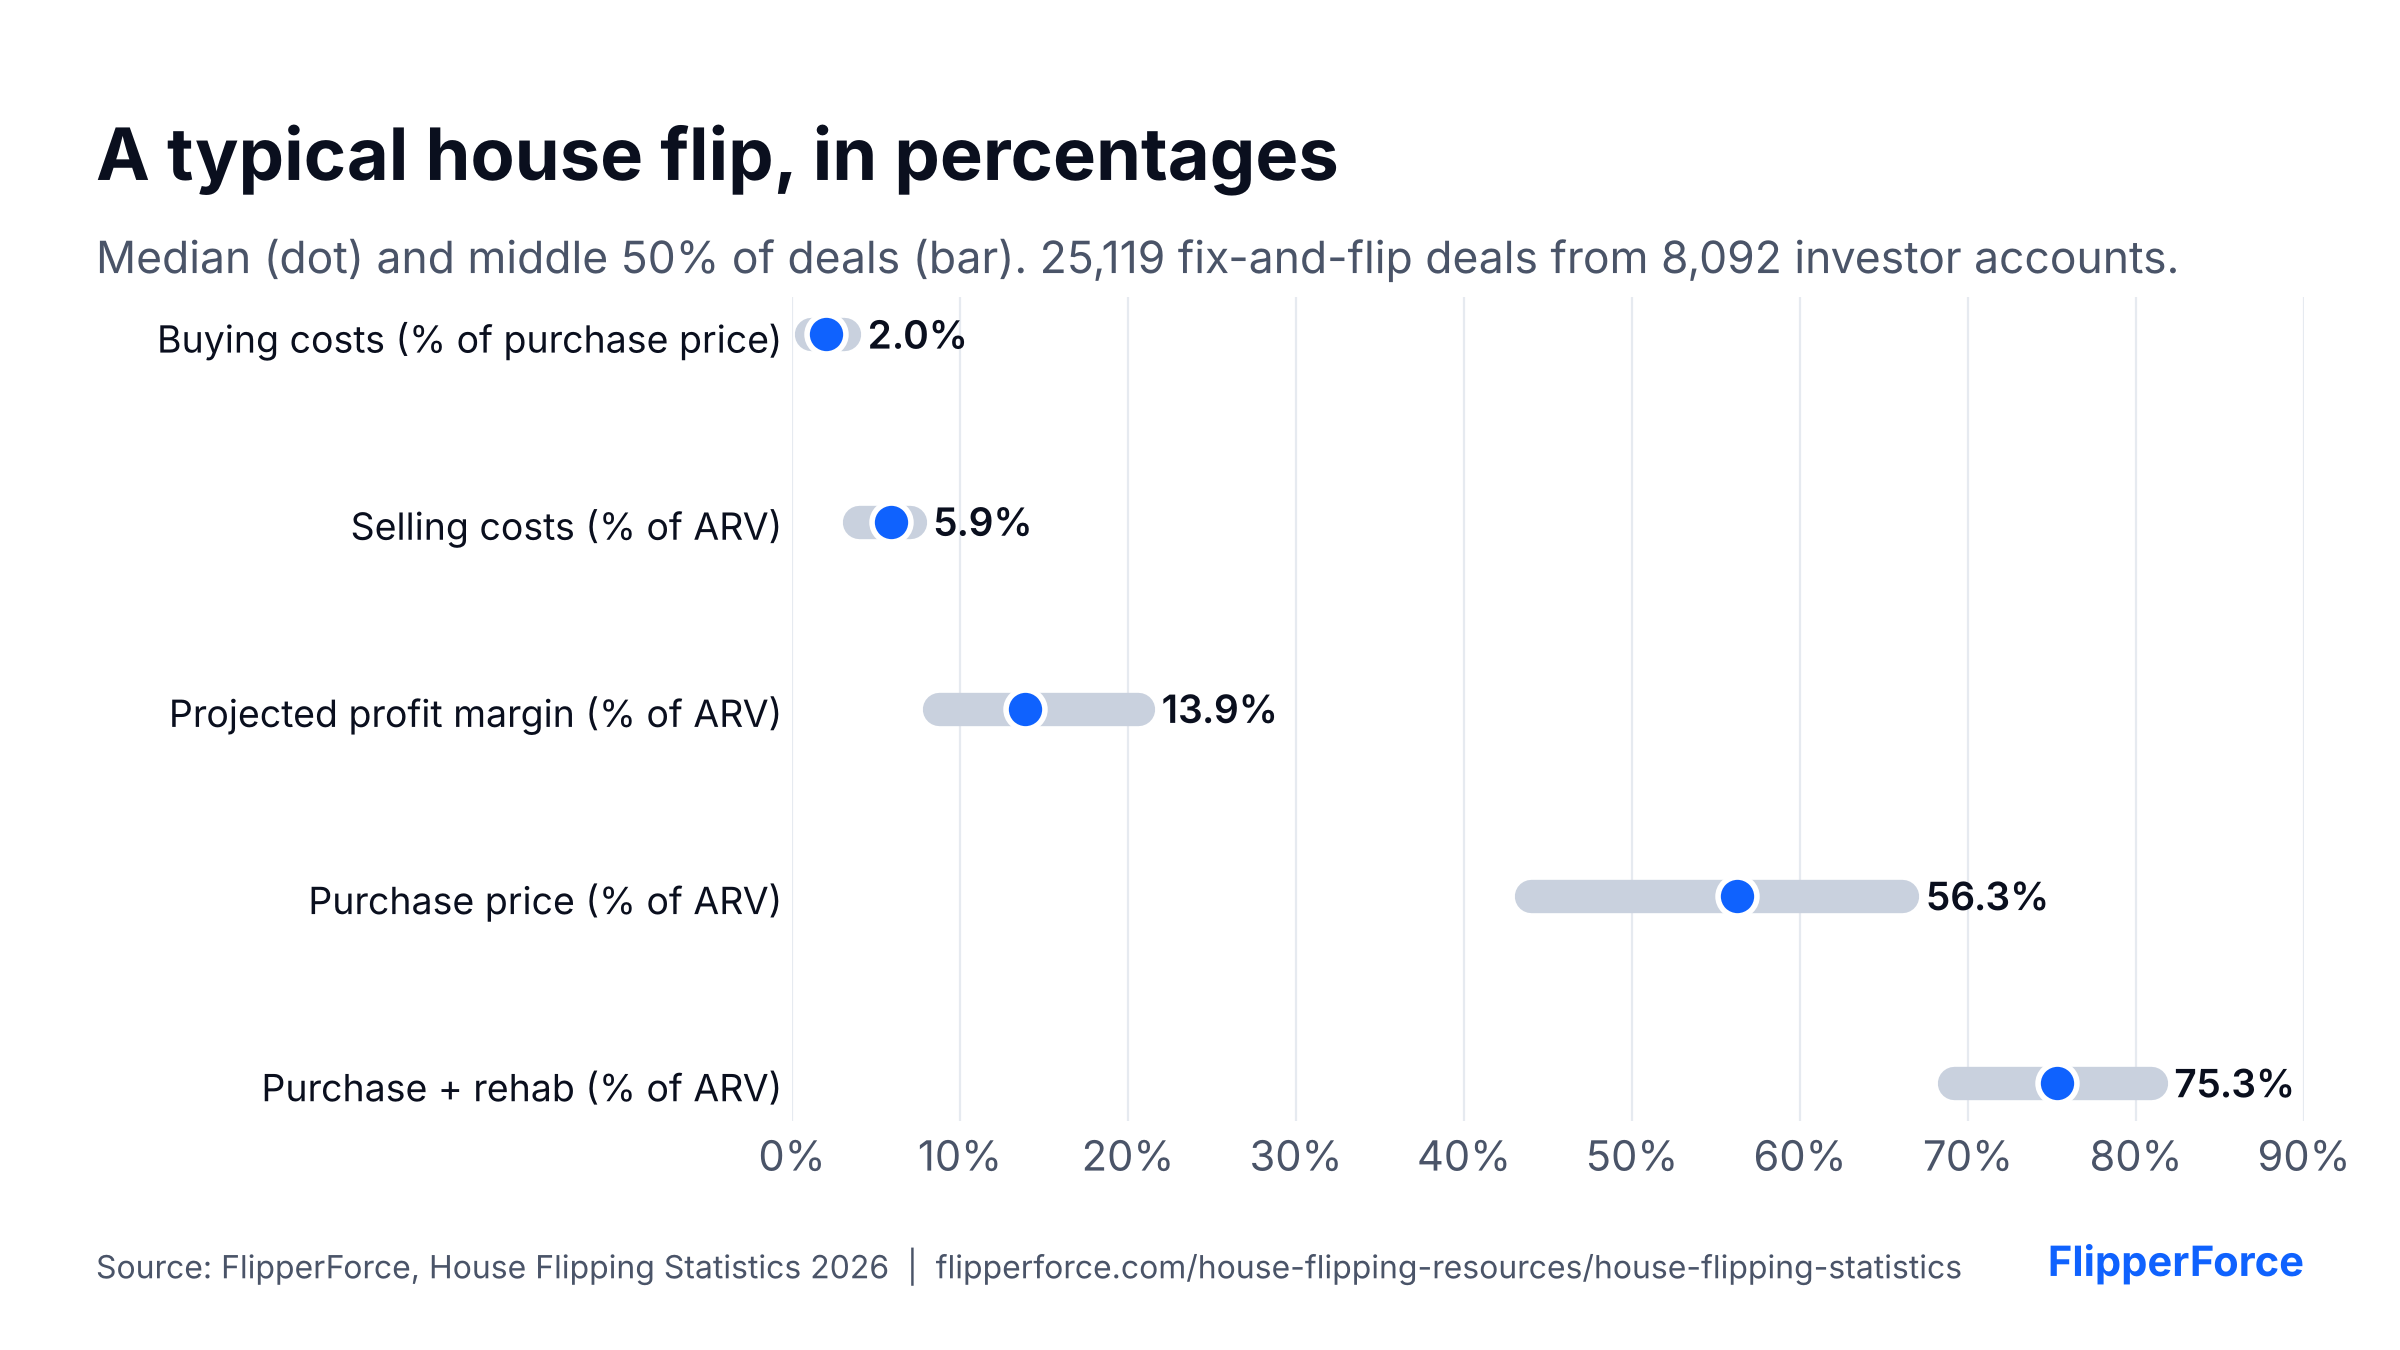
FlipperForce hosts more than 100,000 real estate projects. For this report, we pulled only the fix-and-flip deals with complete, consistent numbers: a qualified sample of 25,119 deals from 8,092 investor accounts. To keep a few large teams from skewing the results, no single account contributed more than 10 deals per half-year, and sample projects that FlipperForce copies into new accounts were removed. The median flip was bought for $185,000, carried a $60,000 rehab budget, and projected a $45,100 profit, a 13.9% margin on the after repair value (ARV). In a stricter subset of completed rehabs where investors tracked every expense against the estimate, nearly 2 in 3 (64.9%) finished over budget.
Key Takeaways
Buying costs: The median investor budgets 2.0% of the purchase price for closing costs, or $3,642 per deal.
Selling costs: The median investor budgets 5.9% of ARV to sell a flip, well under the 8% to 10% rule of thumb.
Selling costs over time: Average selling costs rose from 5.56% of ARV in early 2025 to 5.99% so far in the second half of 2026, as seller concessions grew more common and larger in late 2025 and early 2026.
Rehab costs: The median flip carries a $60,000 rehab budget, or $39 per square foot. By state, median budgets range from $29 per square foot in Oklahoma to $79 in Massachusetts.
Rehab costs over time:The median rehab budget per square foot rose 39%, from $30 in 2020 to $42 in 2026.
Budget overruns: 64.9% of completed rehabs went over the repair estimate, and 29.8% went over by 25% or more.
Profit: The median flip projects $45,100 in profit and a 13.9% margin on ARV.
Margins over time: The median projected margin fell from 15.9% of ARV in 2020 to 12.7% in 2026, as rehab and selling costs rose and resale prices flattened.
The 70% rule:Fewer than 3 in 10 profitable flips meet the 70% rule. The median deal lands at 75% of ARV.
Hold time: The median completed flip took 4.1 months from purchase to sale.
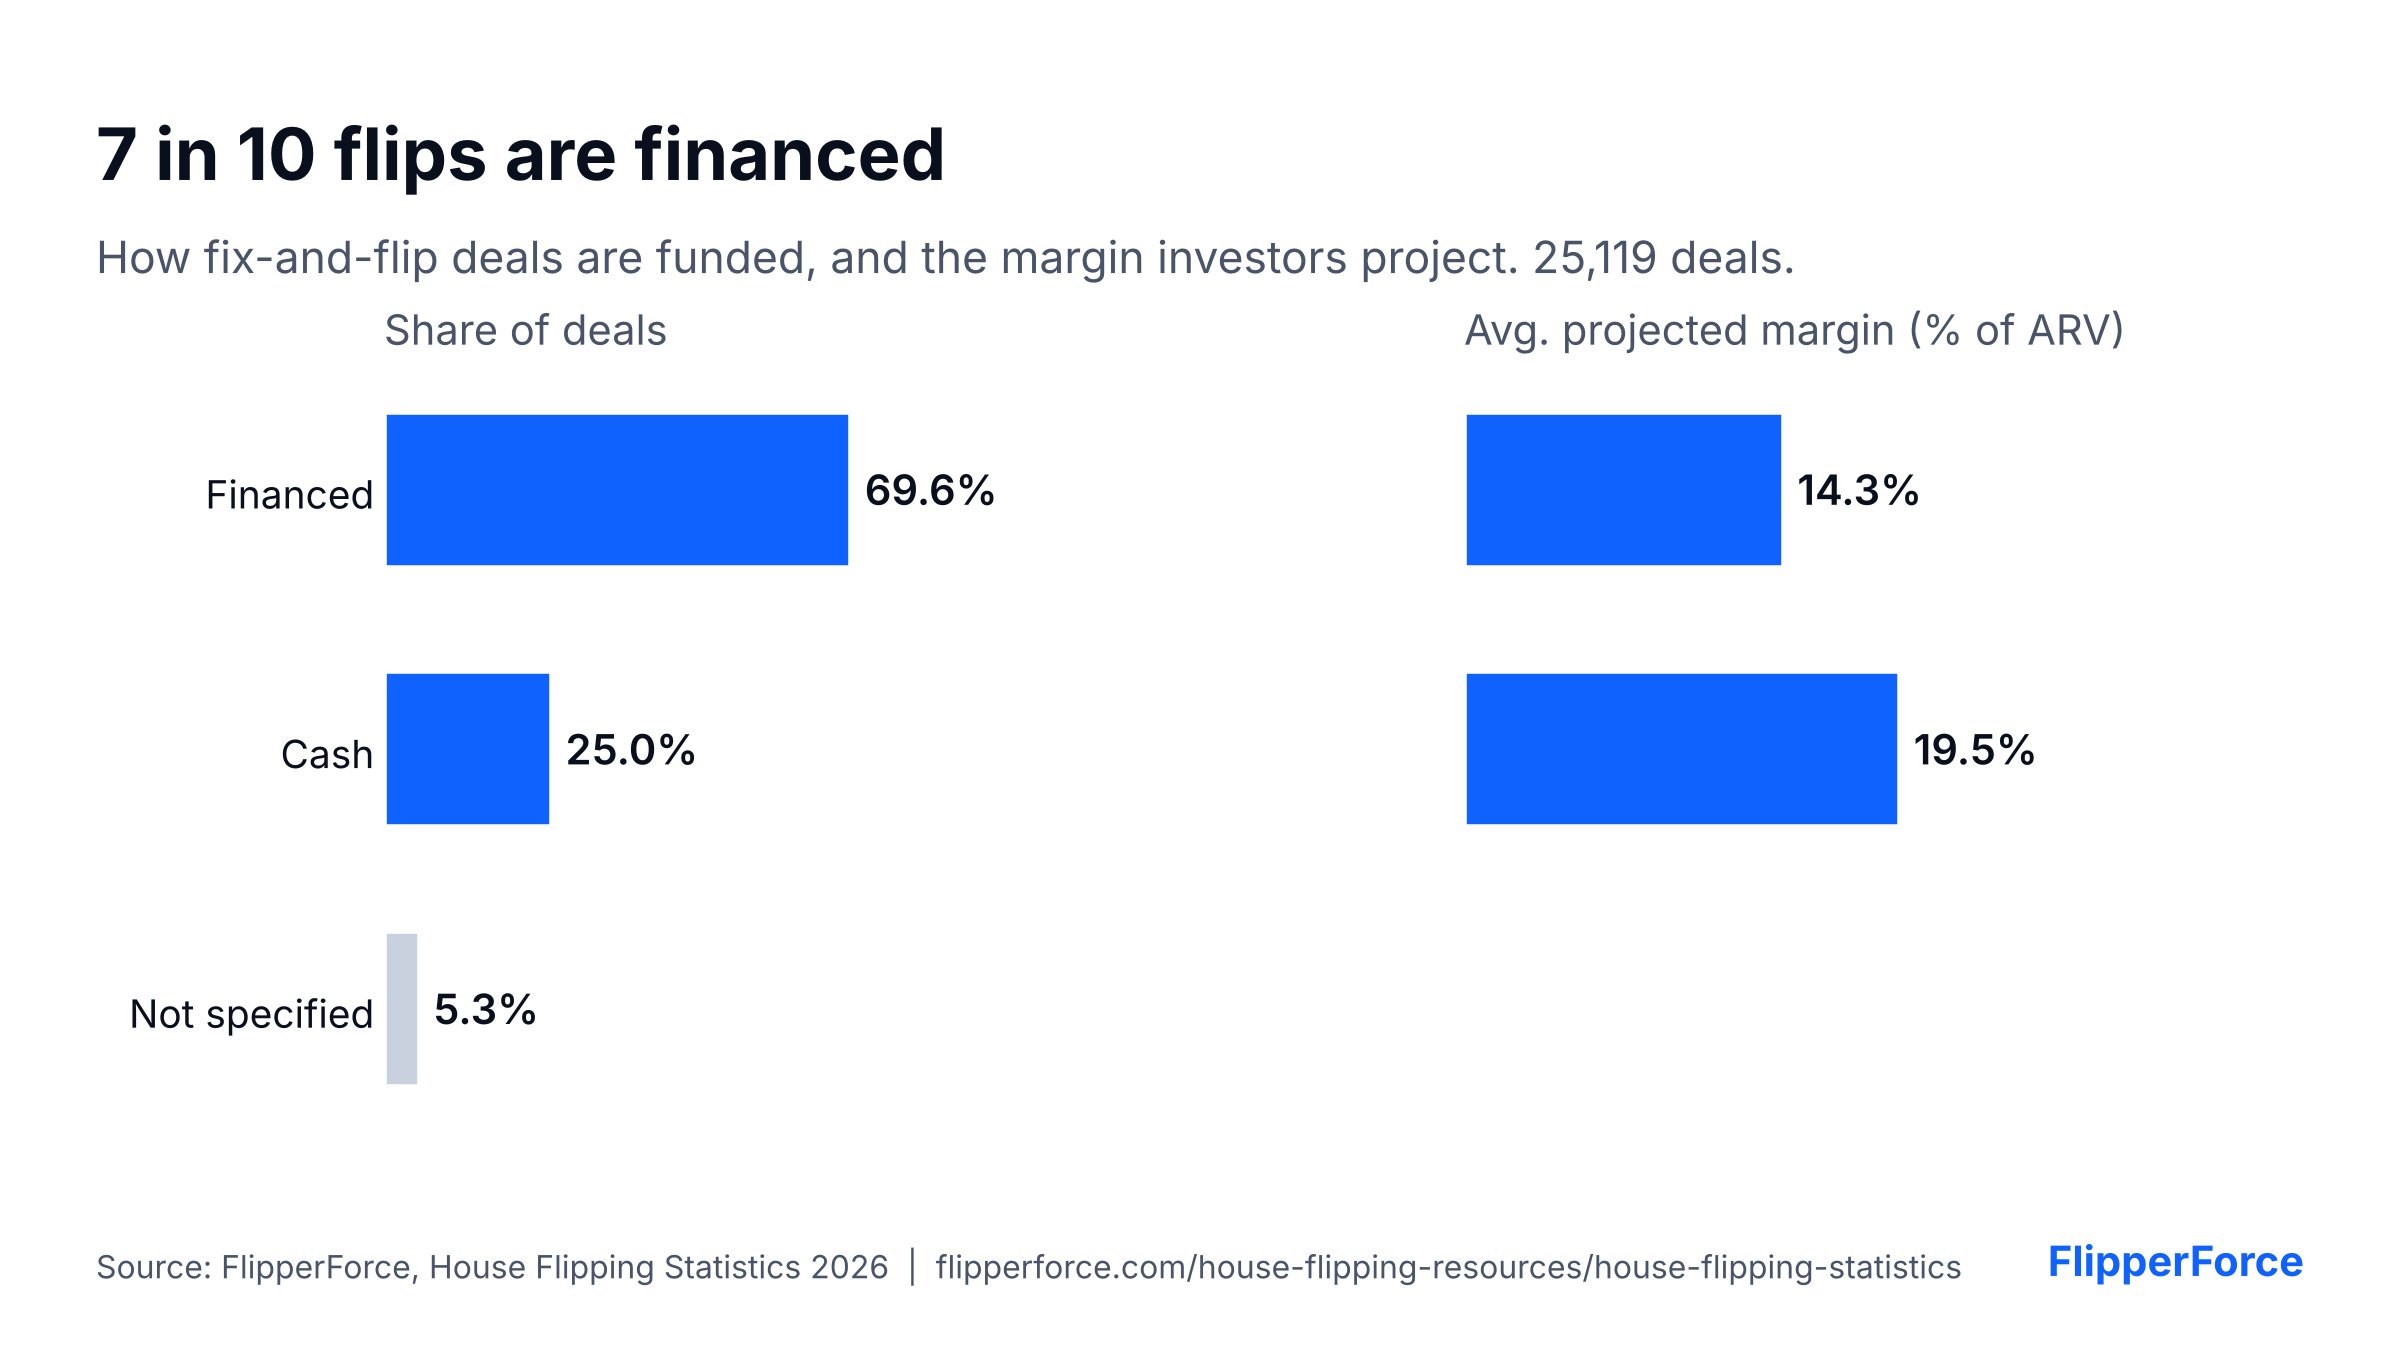
Financing: 69.6% of flips are financed. Cash deals project higher margins (19.5% vs. 14.3% on average).
Benchmark Summary
How to read this table: half of all deals fall between the "Typical range" values. The median is the middle deal.
Free to use with credit. Paste this code into your site:
Metric
Median
Typical range (middle 50%)
Deals
Purchase price
$185,000
$104,900 to $328,000
25,119
After repair value (ARV)
$335,000
$225,000 to $540,000
25,119
Purchase price as % of ARV
56.3%
44.0% to 66.1%
25,119
Buying costs, % of purchase price
2.0%
1.1% to 3.1%
20,837
Buying costs, dollars
$3,642
$1,900 to $7,500
20,837
Rehab budget
$60,000
$39,451 to $96,000
25,119
Rehab budget per sq ft
$39
$25 to $60
17,715
Holding costs per month
$592
$378 to $1,000
18,563
Planned hold time
5 months
4 to 6 months
20,535
Selling costs, % of ARV
5.9%
4.0% to 7.0%
22,524
Selling costs, dollars
$18,500
$12,000 to $29,929
22,524
(Purchase + rehab) as % of ARV
75.3%
69.2% to 80.9%
25,086
Projected profit
$45,100
$27,572 to $75,800
25,119
Projected profit margin (% of ARV)
13.9%
8.8% to 20.6%
25,119
Source: FlipperForce analysis of 25,119 fix-and-flip deals from 8,092 investor accounts, 2018 to 2026. No account contributes more than 10 deals per half-year. Sample projects excluded.
What Are Typical Closing Costs When Buying a Flip?
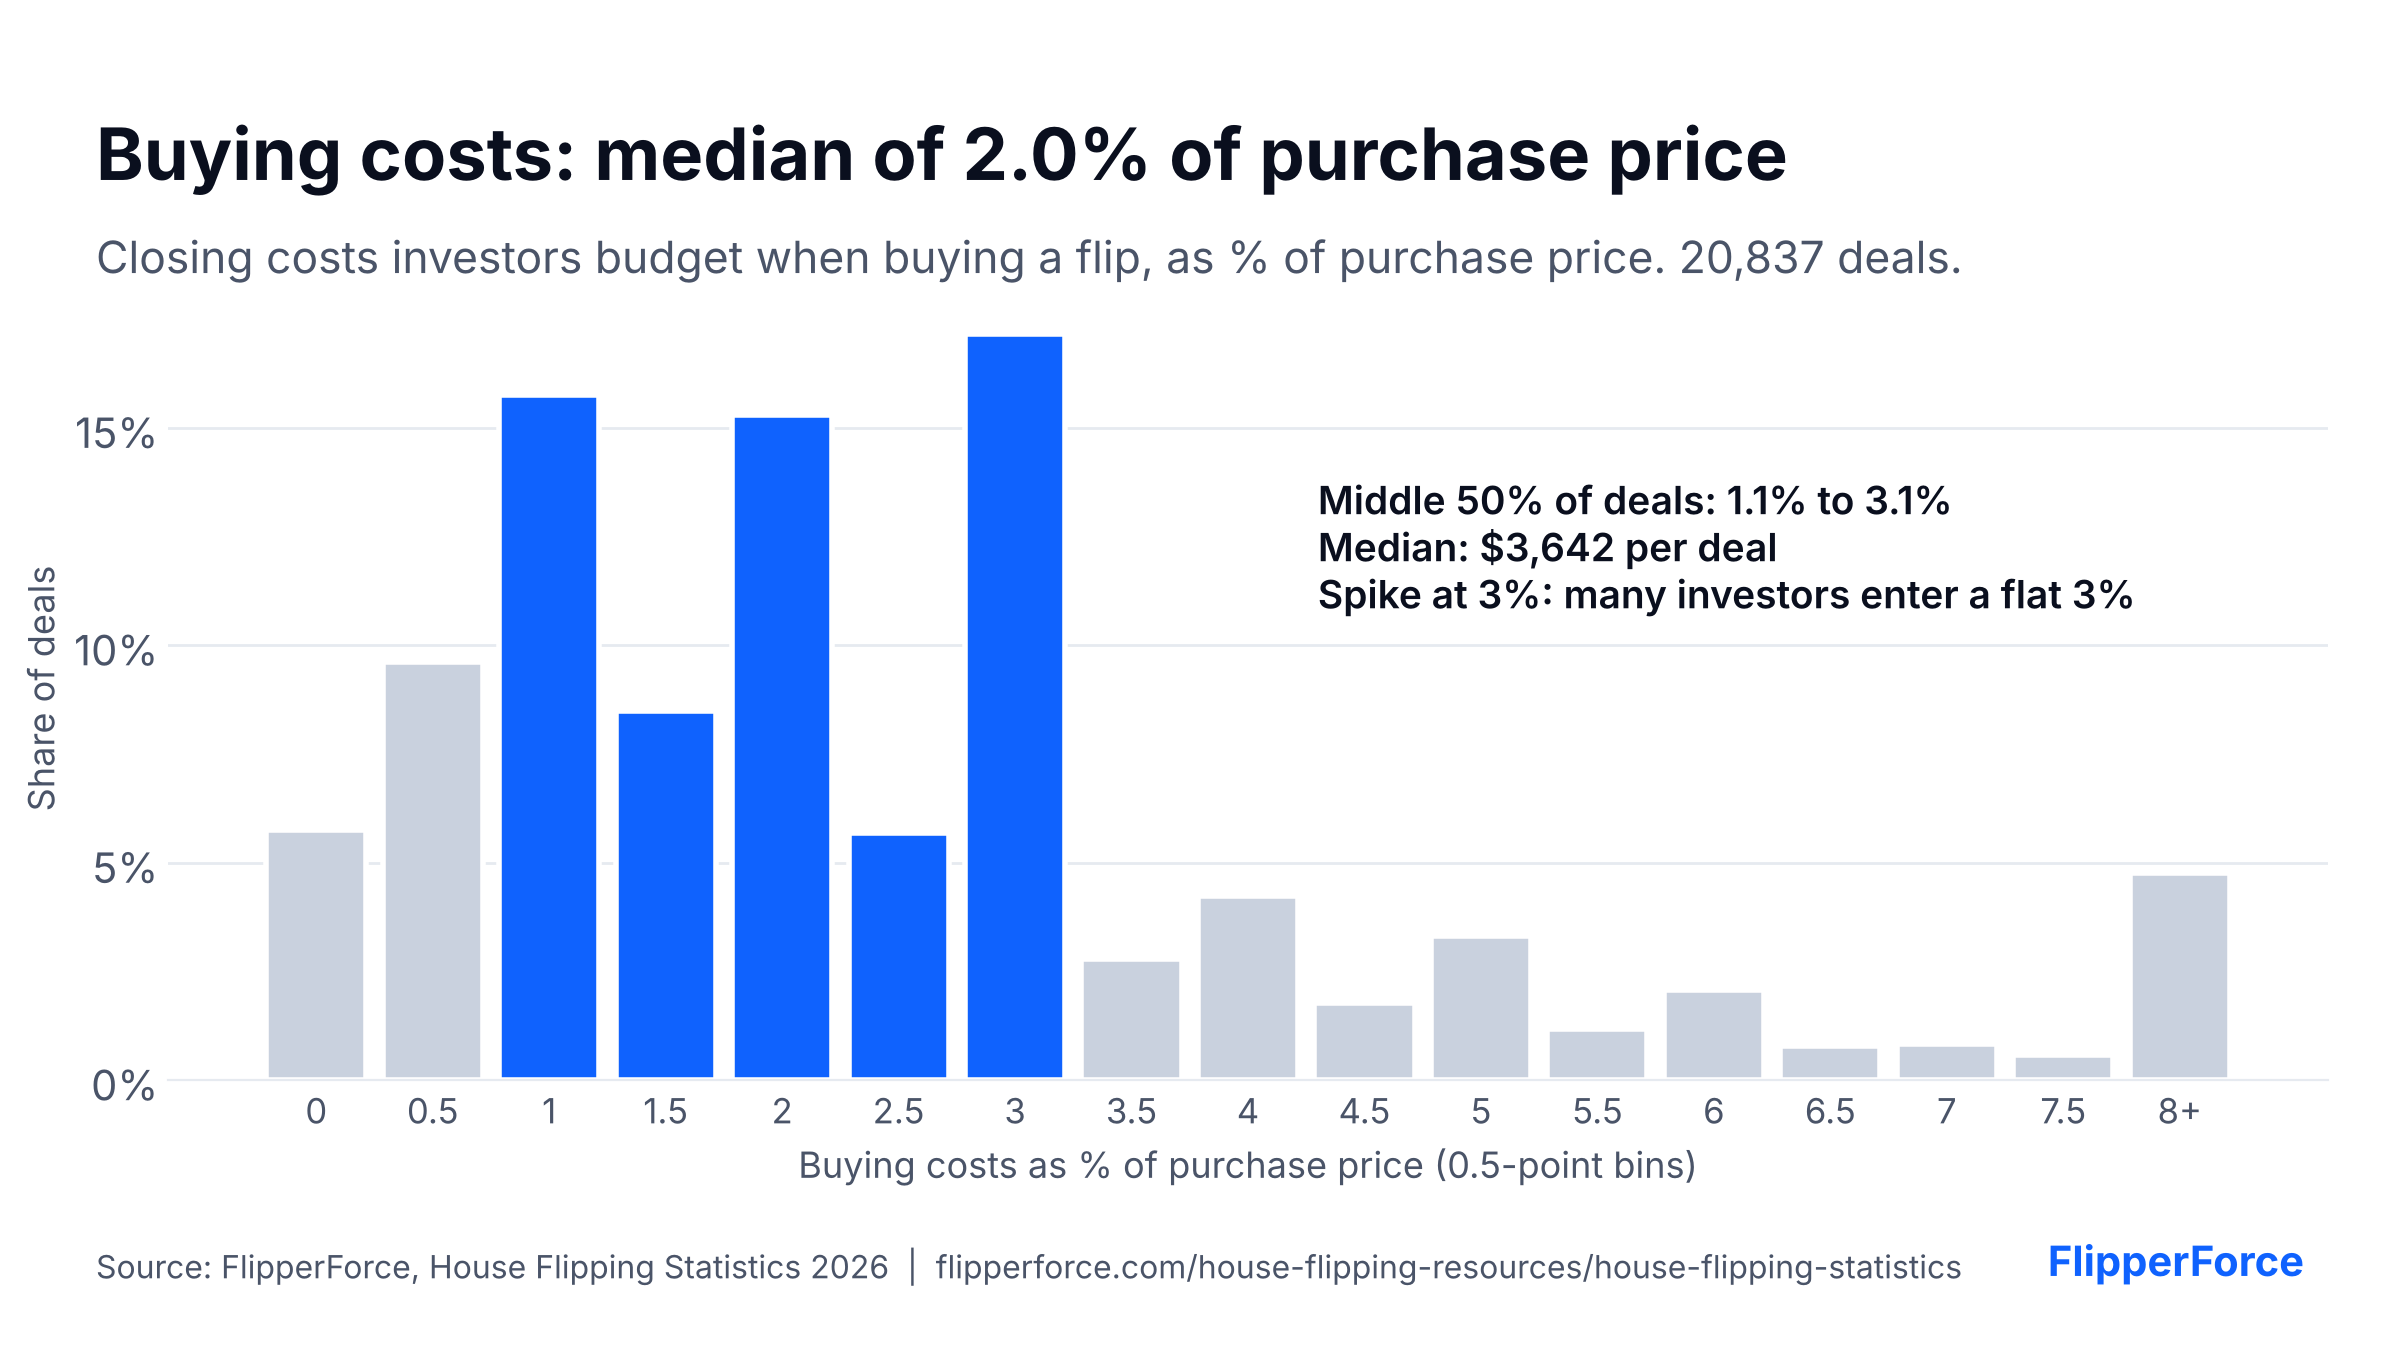
The median house flipper budgets 2.0% of the purchase price for buying costs, based on 20,837 fix-and-flip deals analyzed in FlipperForce. Half of all investors budget between 1.1% and 3.1%. In dollars, the median is $3,642, with a typical range of $1,900 to $7,500.
Free to use with credit. Paste this code into your site:
Buying costs typically include title and escrow fees, recording fees, lender origination points, and inspections. They vary by state: investors in Colorado budget about 1.6% on average, while investors in Maryland and Pennsylvania budget over 4% (see the state table below).
Rule of thumb: If you have no local quote yet, budget 2% to 3% of the purchase price for closing costs, and confirm transfer taxes in your state.
How Much Does It Cost to Sell a Flipped House?
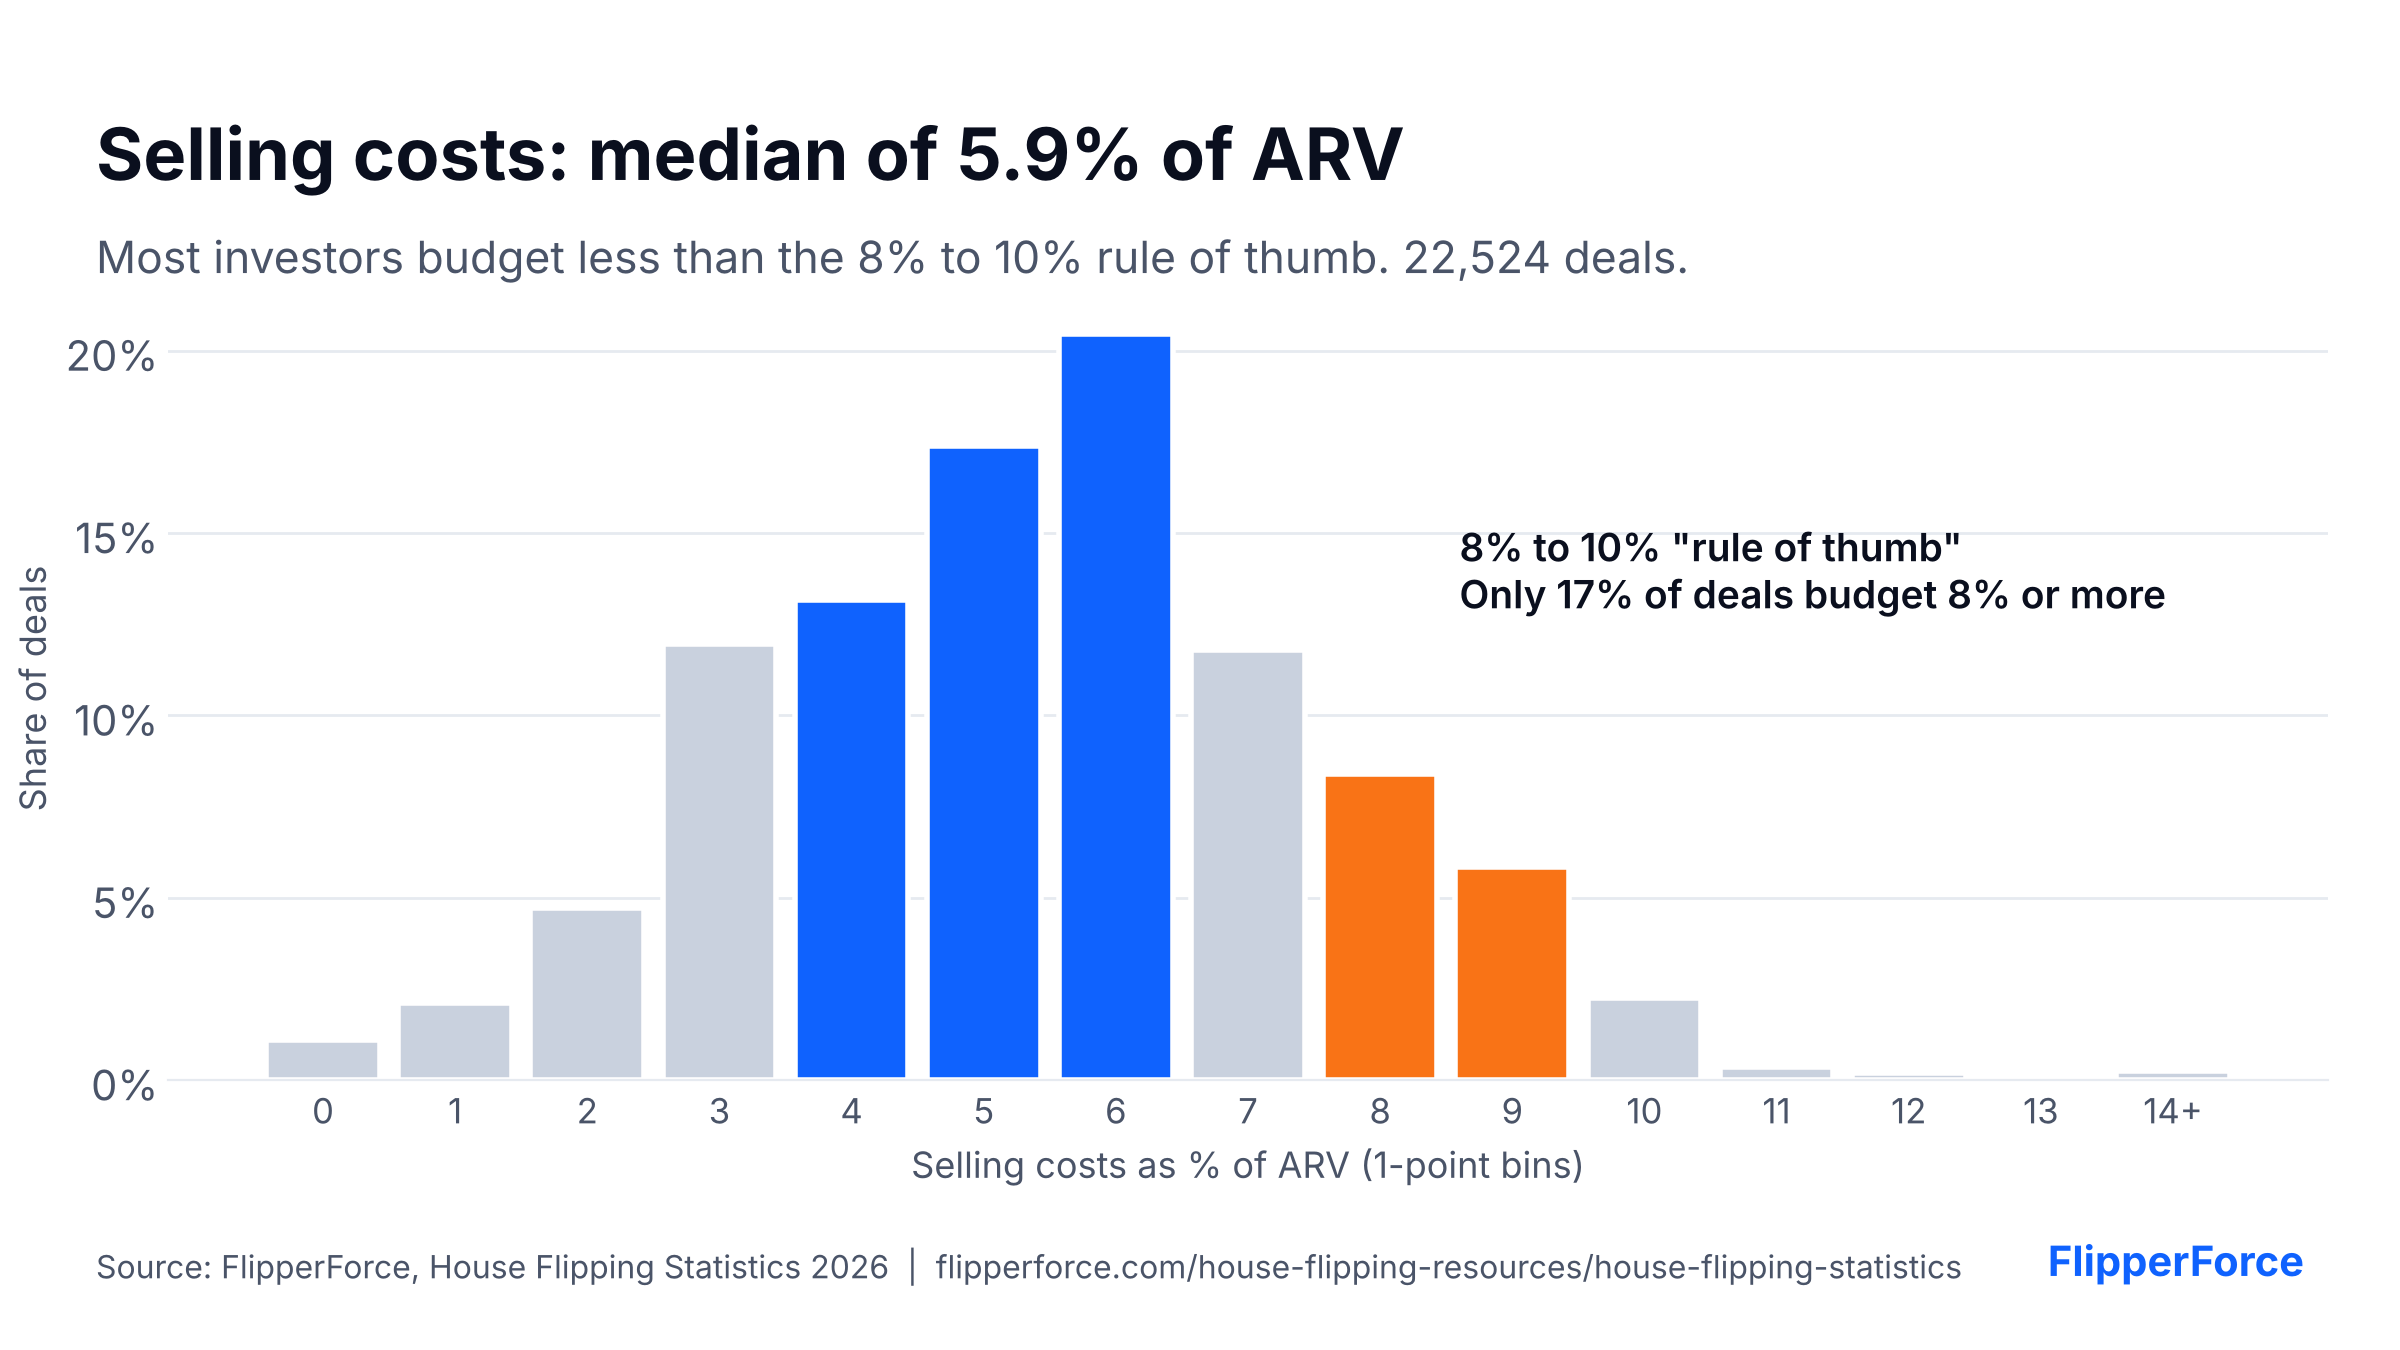
The median investor budgets 5.9% of the ARV in selling costs, based on 22,524 deals. The middle half of investors budget between 4.0% and 7.0%. That is lower than the 8% to 10% figure many house flipping courses still teach. Only 17% of deals budget 8% or more. In dollars, the median is $18,500.
Free to use with credit. Paste this code into your site:
Selling costs include agent commissions, seller concessions, title and escrow on the sale side, and transfer taxes where the seller pays them.
How Have Selling Costs Changed Over Time?
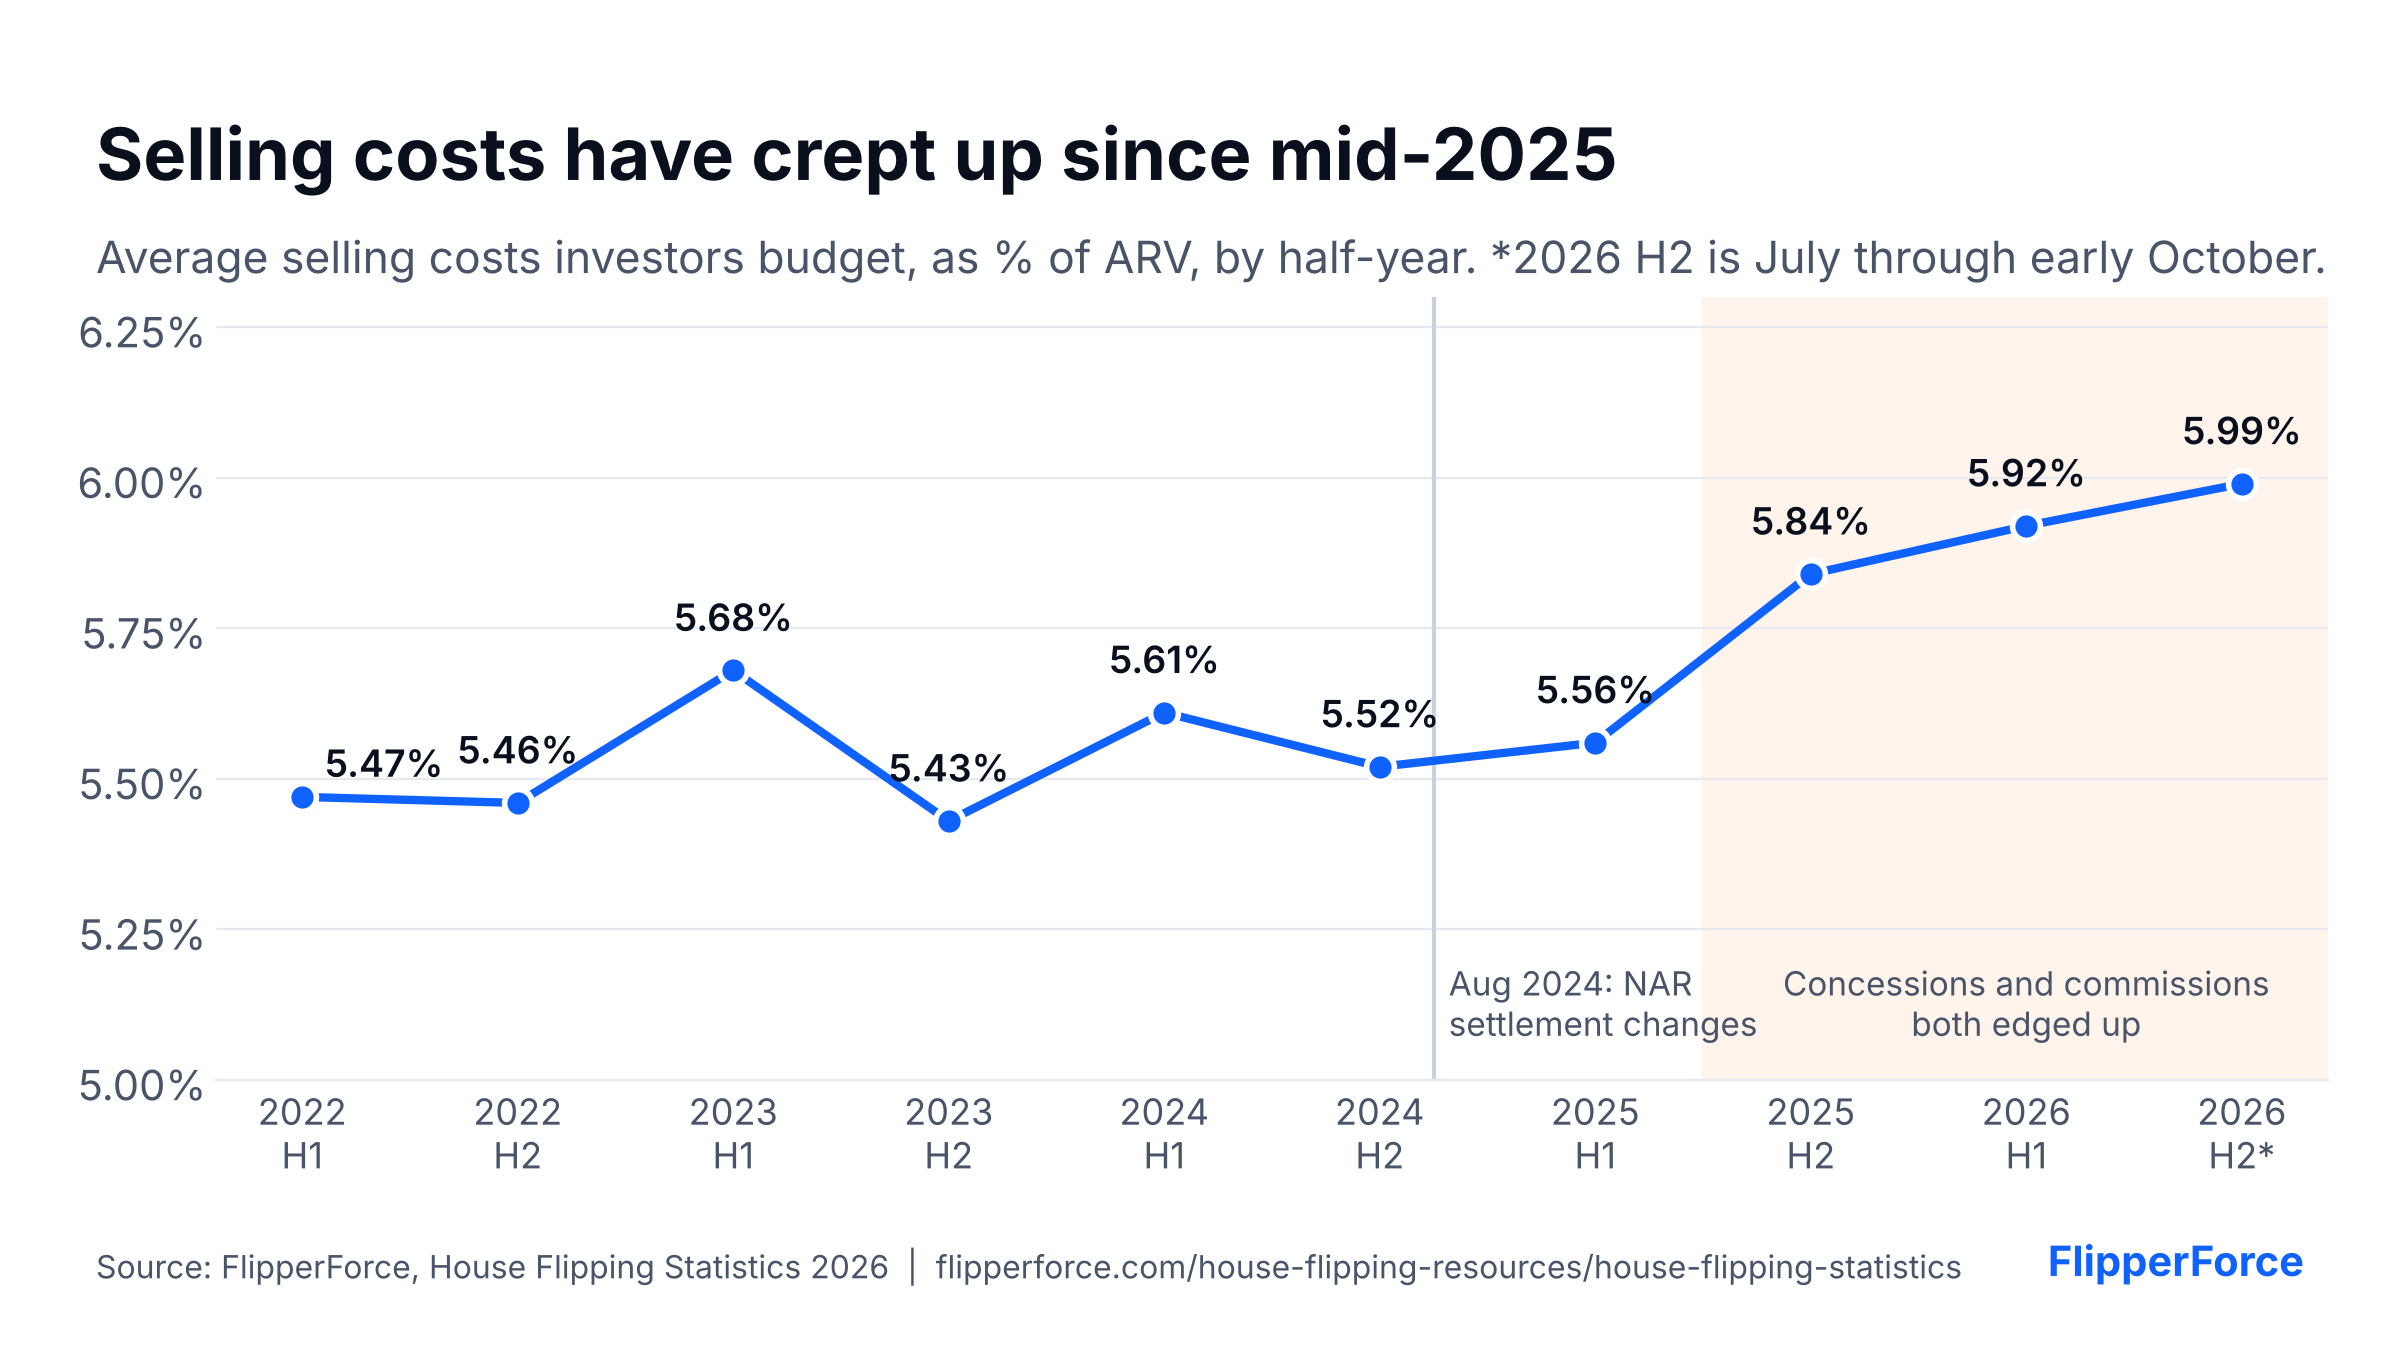
Average selling costs held steady between 5.4% and 5.7% of ARV from 2022 through early 2025. Since mid-2025, they have risen every half-year: 5.84% in the second half of 2025, 5.92% in the first half of 2026, and 5.99% so far in the second half of 2026. Seller concessions are part of the reason. Trend figures group deals by the year each one was analyzed in FlipperForce, with the same 10-deals-per-account limit. 2026 is year to date through early October.
Free to use with credit. Paste this code into your site:
When investors itemize their selling costs, we can see which lines moved. Seller concessions became more common and larger. From 2022 through early 2025, between 31% and 40% of itemized deals included a concession for the buyer. In the second half of 2025 and the first half of 2026, about 43% did. The size of concessions grew too: from about 1.6% to 1.75% of ARV when used, to between 1.8% and 2.0% since mid-2025. The partial second half of 2026 is a smaller sample, and its concession share (38%) is closer to the older range, so we will watch whether that holds.
Half-year
Avg. selling costs (% of ARV)
Itemized deals with a seller concession
Avg. concession when used (% of ARV)
Avg. commission (% of ARV)
2022 H1
5.47%
36%
1.70%
4.39%
2022 H2
5.46%
38%
1.75%
4.37%
2023 H1
5.68%
40%
1.75%
4.53%
2023 H2
5.43%
31%
1.60%
4.22%
2024 H1
5.61%
35%
1.71%
4.36%
2024 H2
5.52%
37%
1.69%
4.18%
2025 H1
5.56%
40%
1.73%
4.05%
2025 H2
5.84%
43%
1.85%
4.36%
2026 H1
5.92%
43%
1.80%
4.43%
2026 H2*
5.99%
38%
1.96%
4.47%
Source: FlipperForce analysis of fix-and-flip deals by half-year analyzed. Concession and commission columns use deals where the investor itemized selling costs. 2026 H2 is July through early October.
We believe this reflects a slower market. With fewer buyers and more homes for sale, flippers are budgeting to cover part of the buyer's closing costs to get deals closed. Budgeted agent commissions also edged back up, from 4.05% of ARV in early 2025 to about 4.4% to 4.5% since. The NAR settlement changes that took effect in August 2024 were expected to push commissions down. So far, they have not lowered what investors budget to sell a flip.
How Much Does a Flip Rehab Cost?
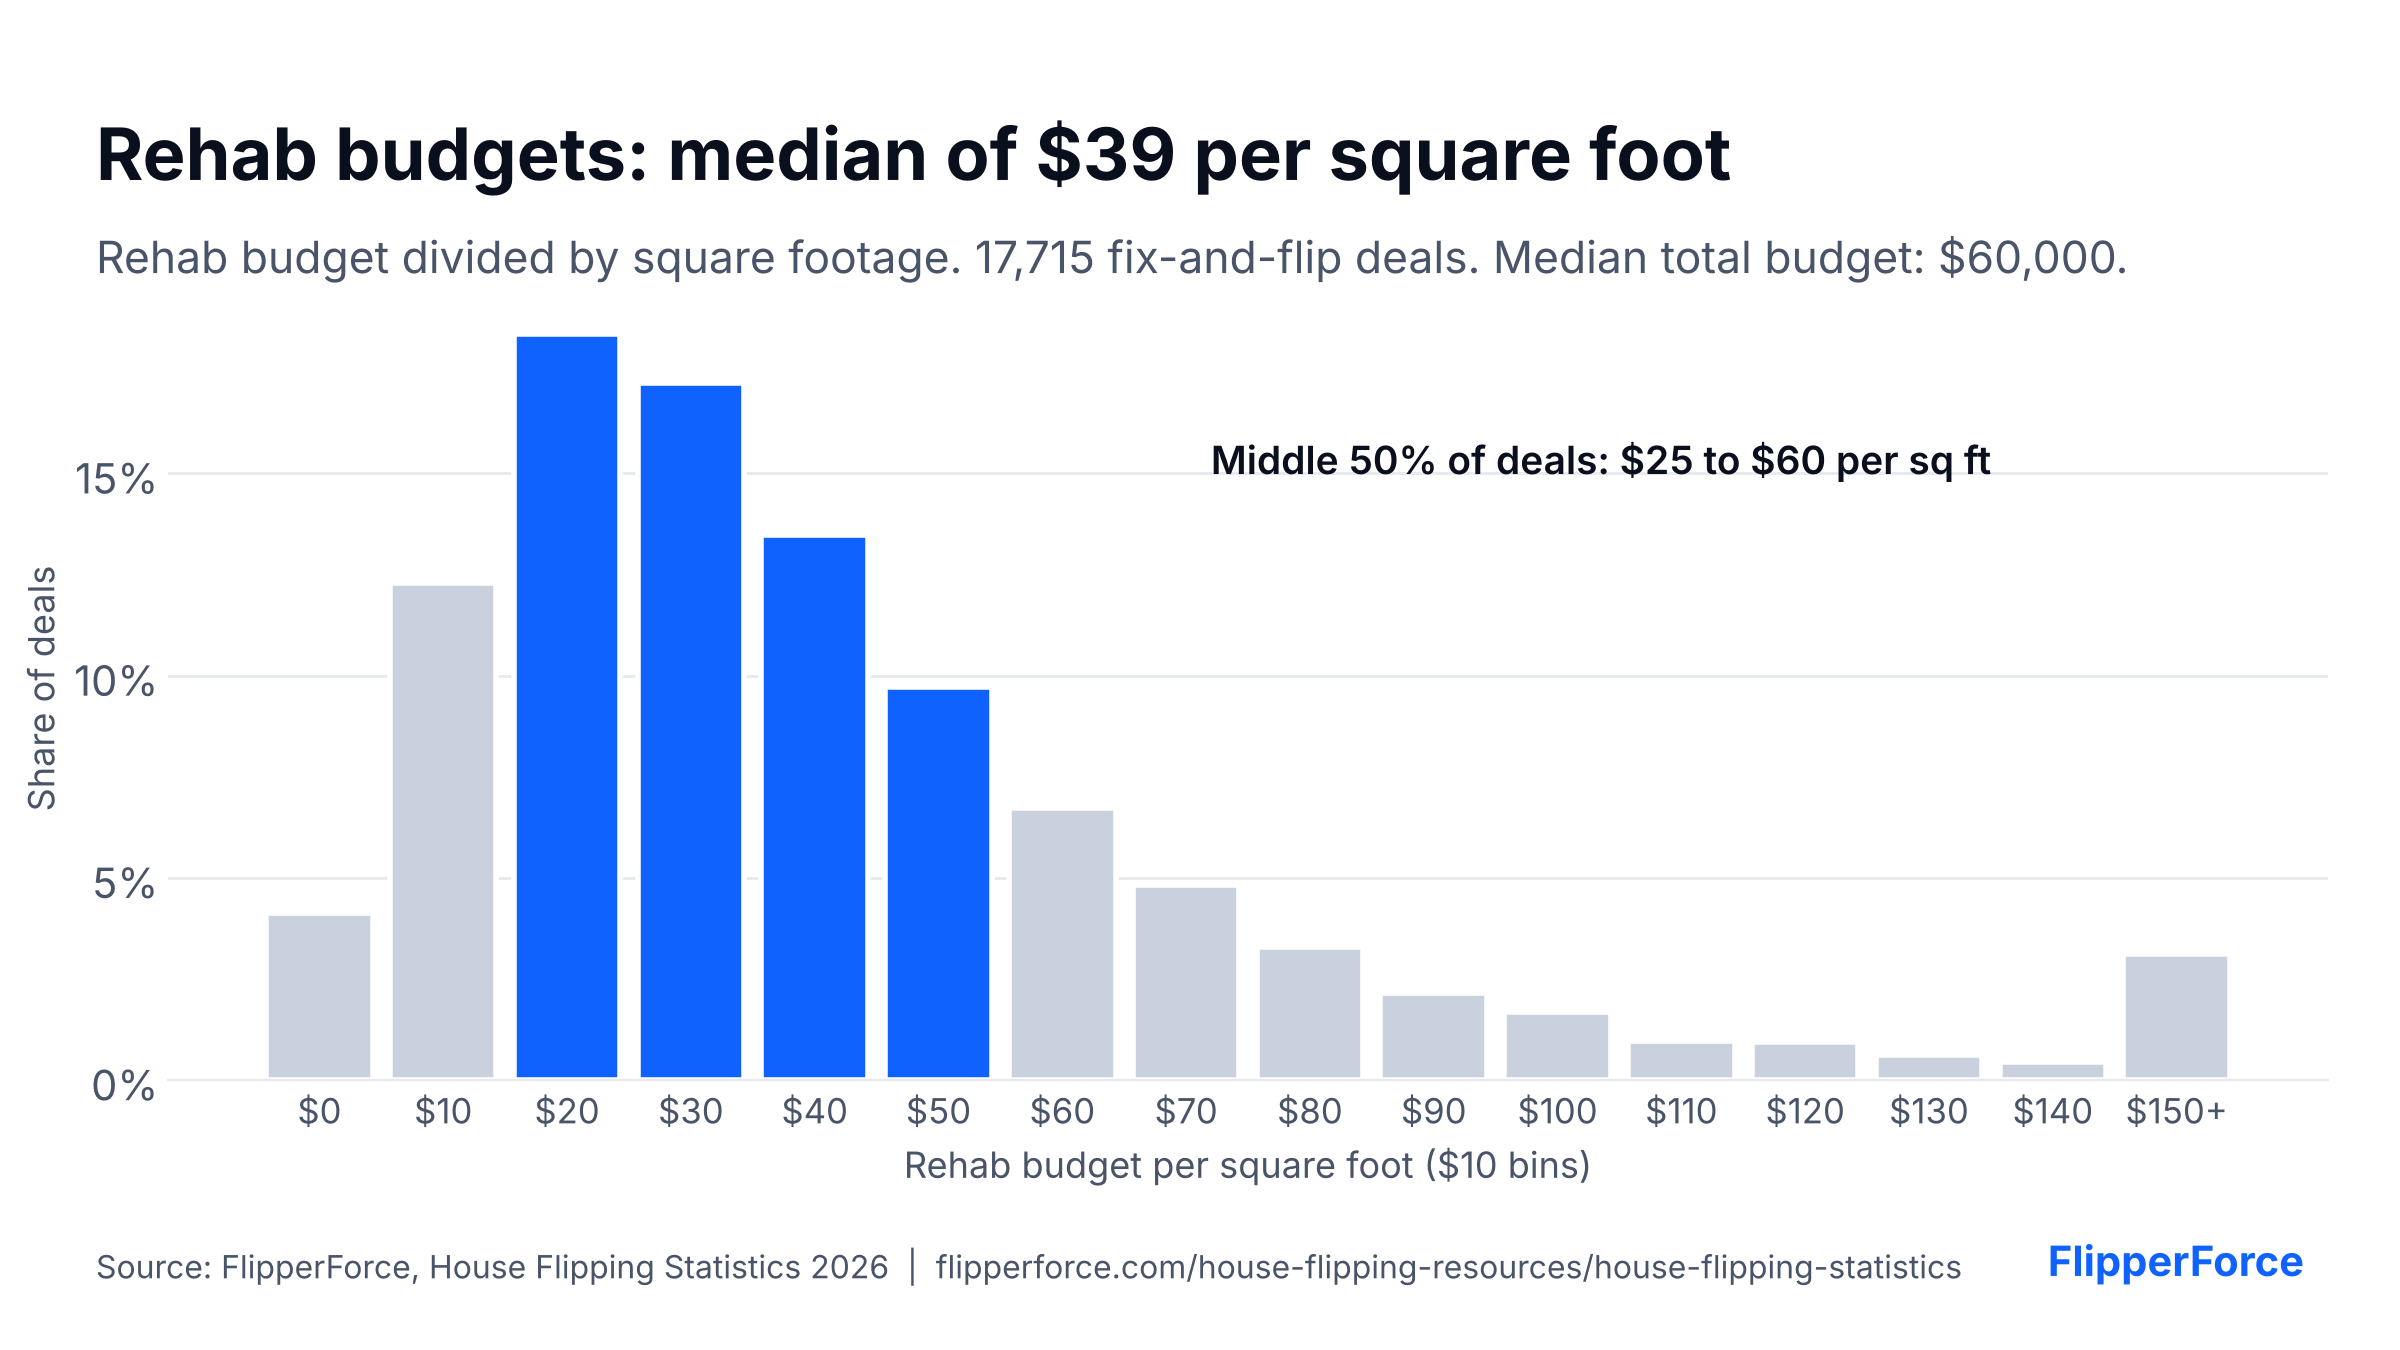
The median rehab budget is $60,000 per flip, based on 25,119 deals. The middle half of budgets fall between $39,451 and $96,000. Measured by size, the median rehab budget is $39 per square foot (17,715 deals with square footage), with a typical range of $25 to $60 per square foot.
Free to use with credit. Paste this code into your site:
Rehab Cost per Square Foot by State
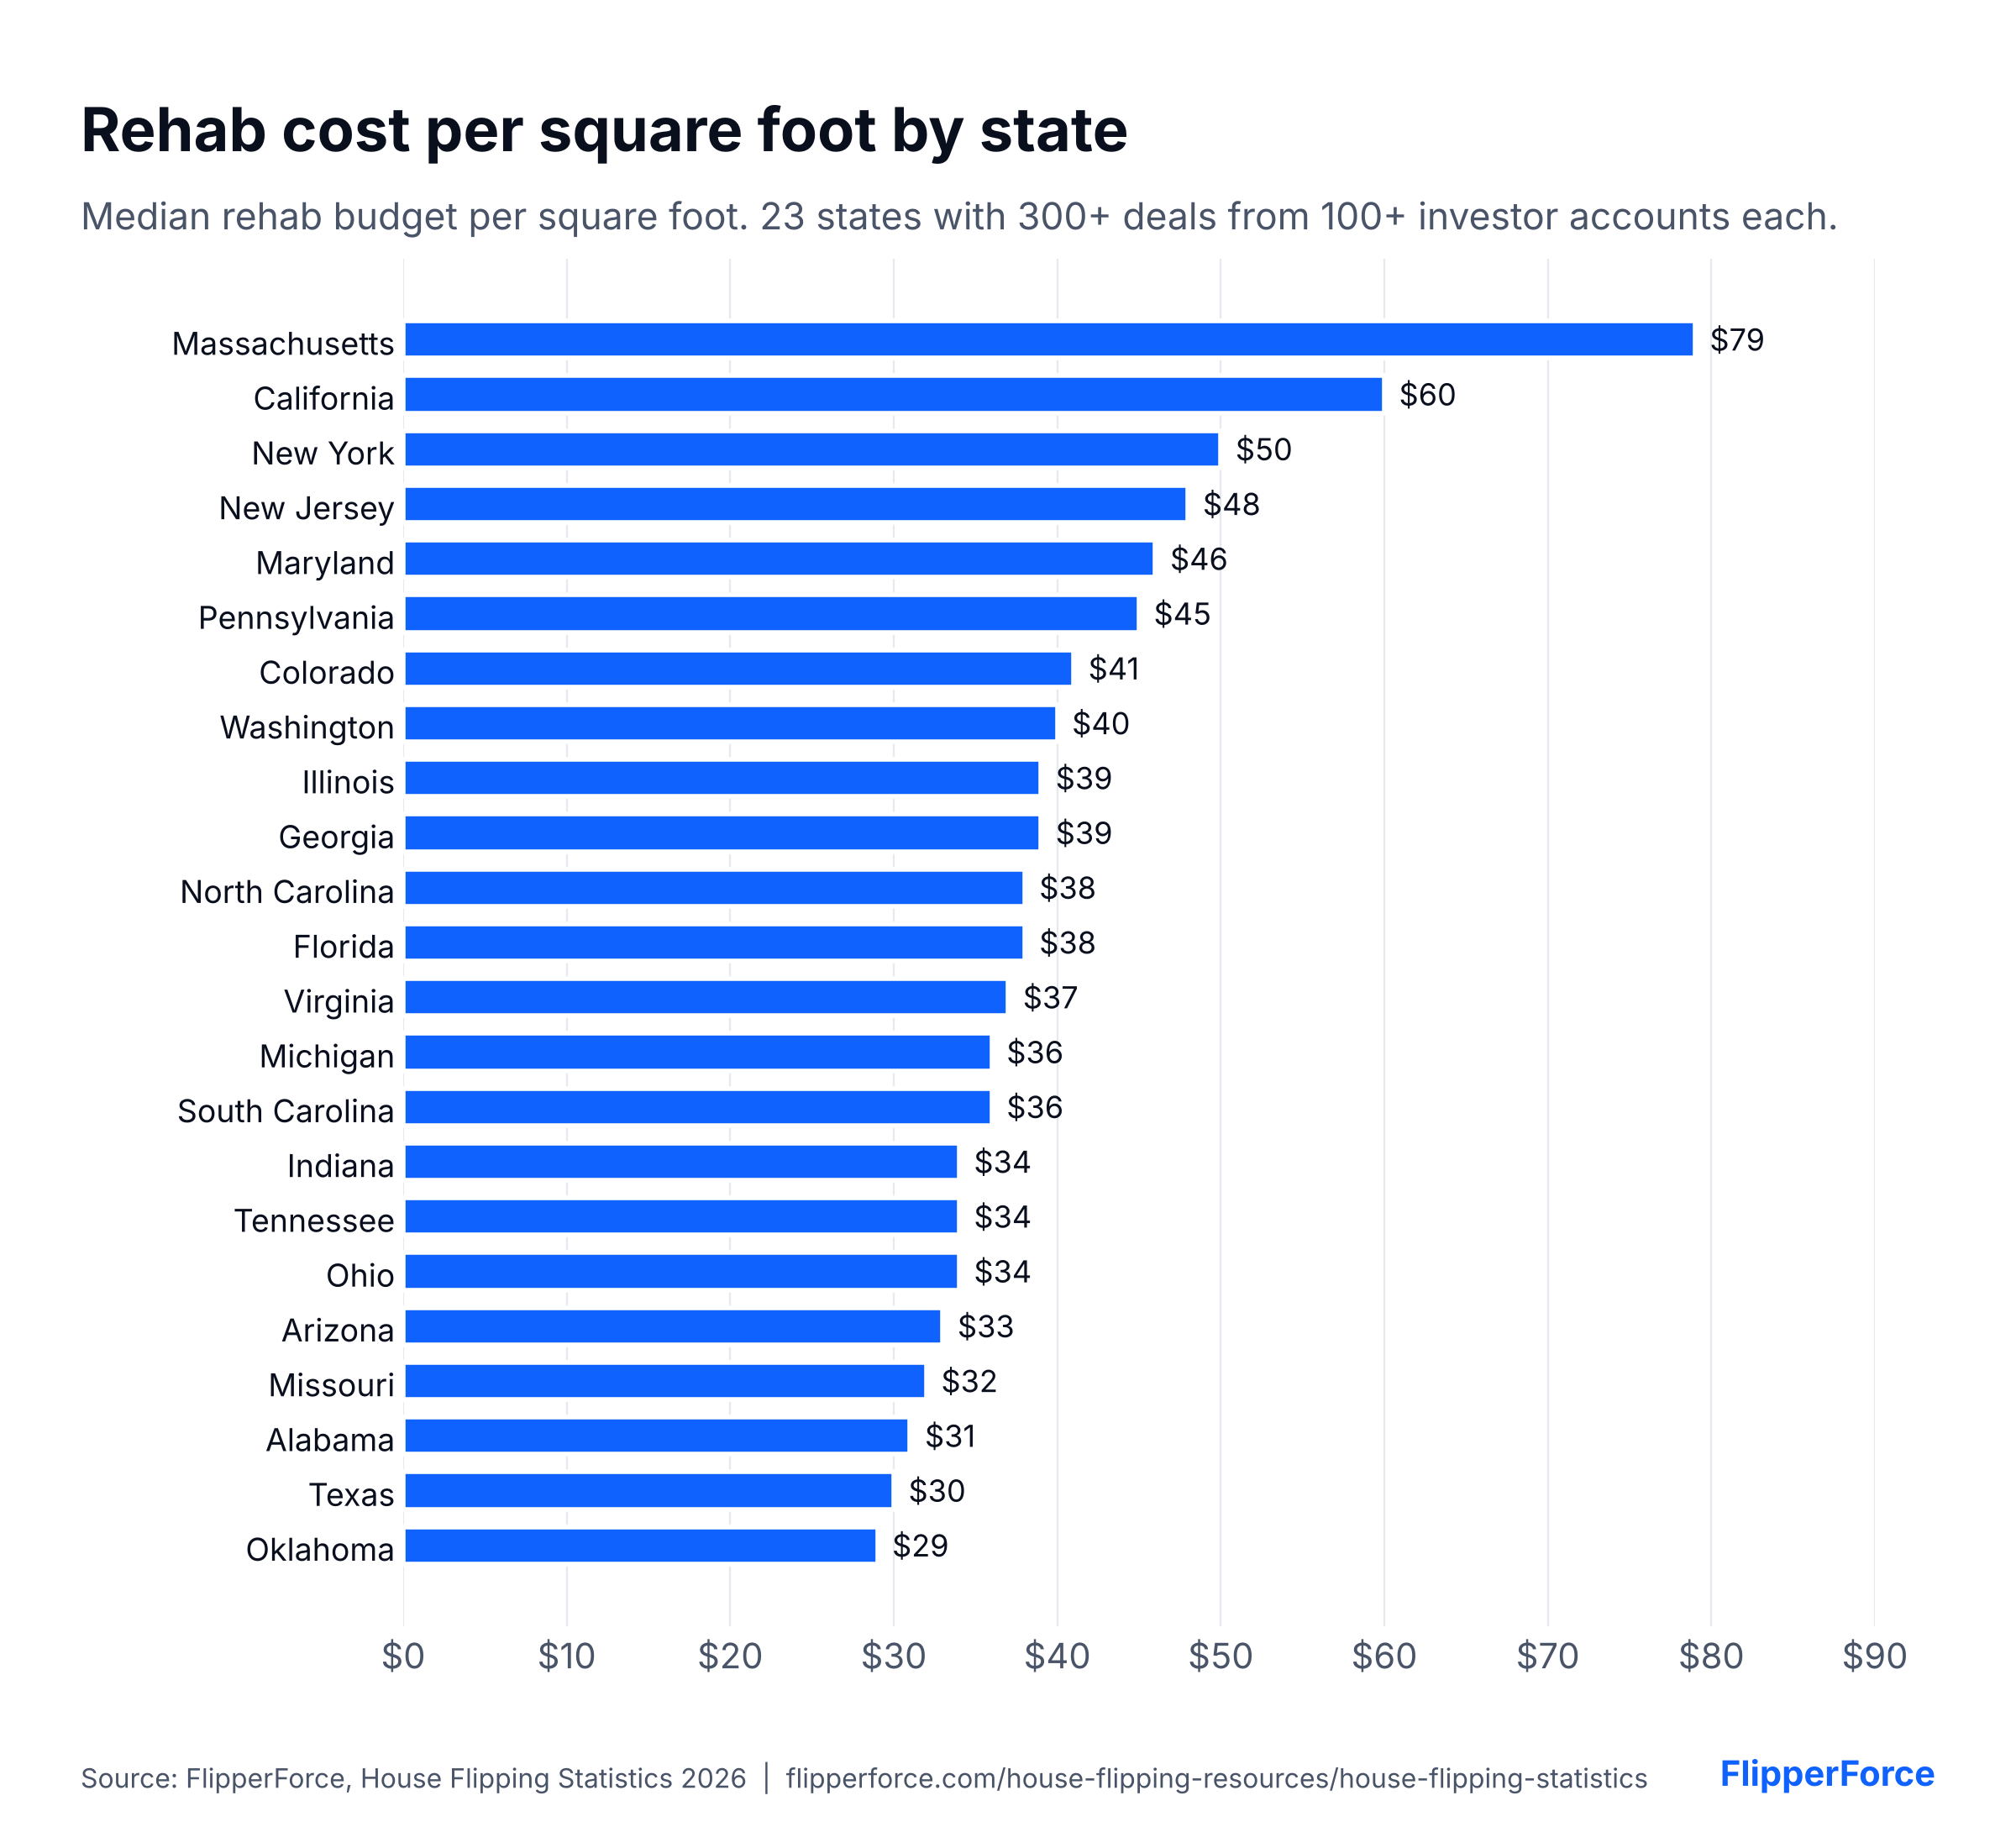
Where you flip changes your rehab budget more than almost anything else. The median rehab budget in Massachusetts is $79 per square foot, and in California it is $60. In Texas it is $30, and in Oklahoma $29. A Massachusetts flip budgets more than 2.5 times as much per square foot as a Texas flip. We believe higher labor rates, stricter permitting, and older housing stock are what push coastal markets to the top.
Free to use with credit. Paste this code into your site:
How Have Rehab Costs Changed Over Time?
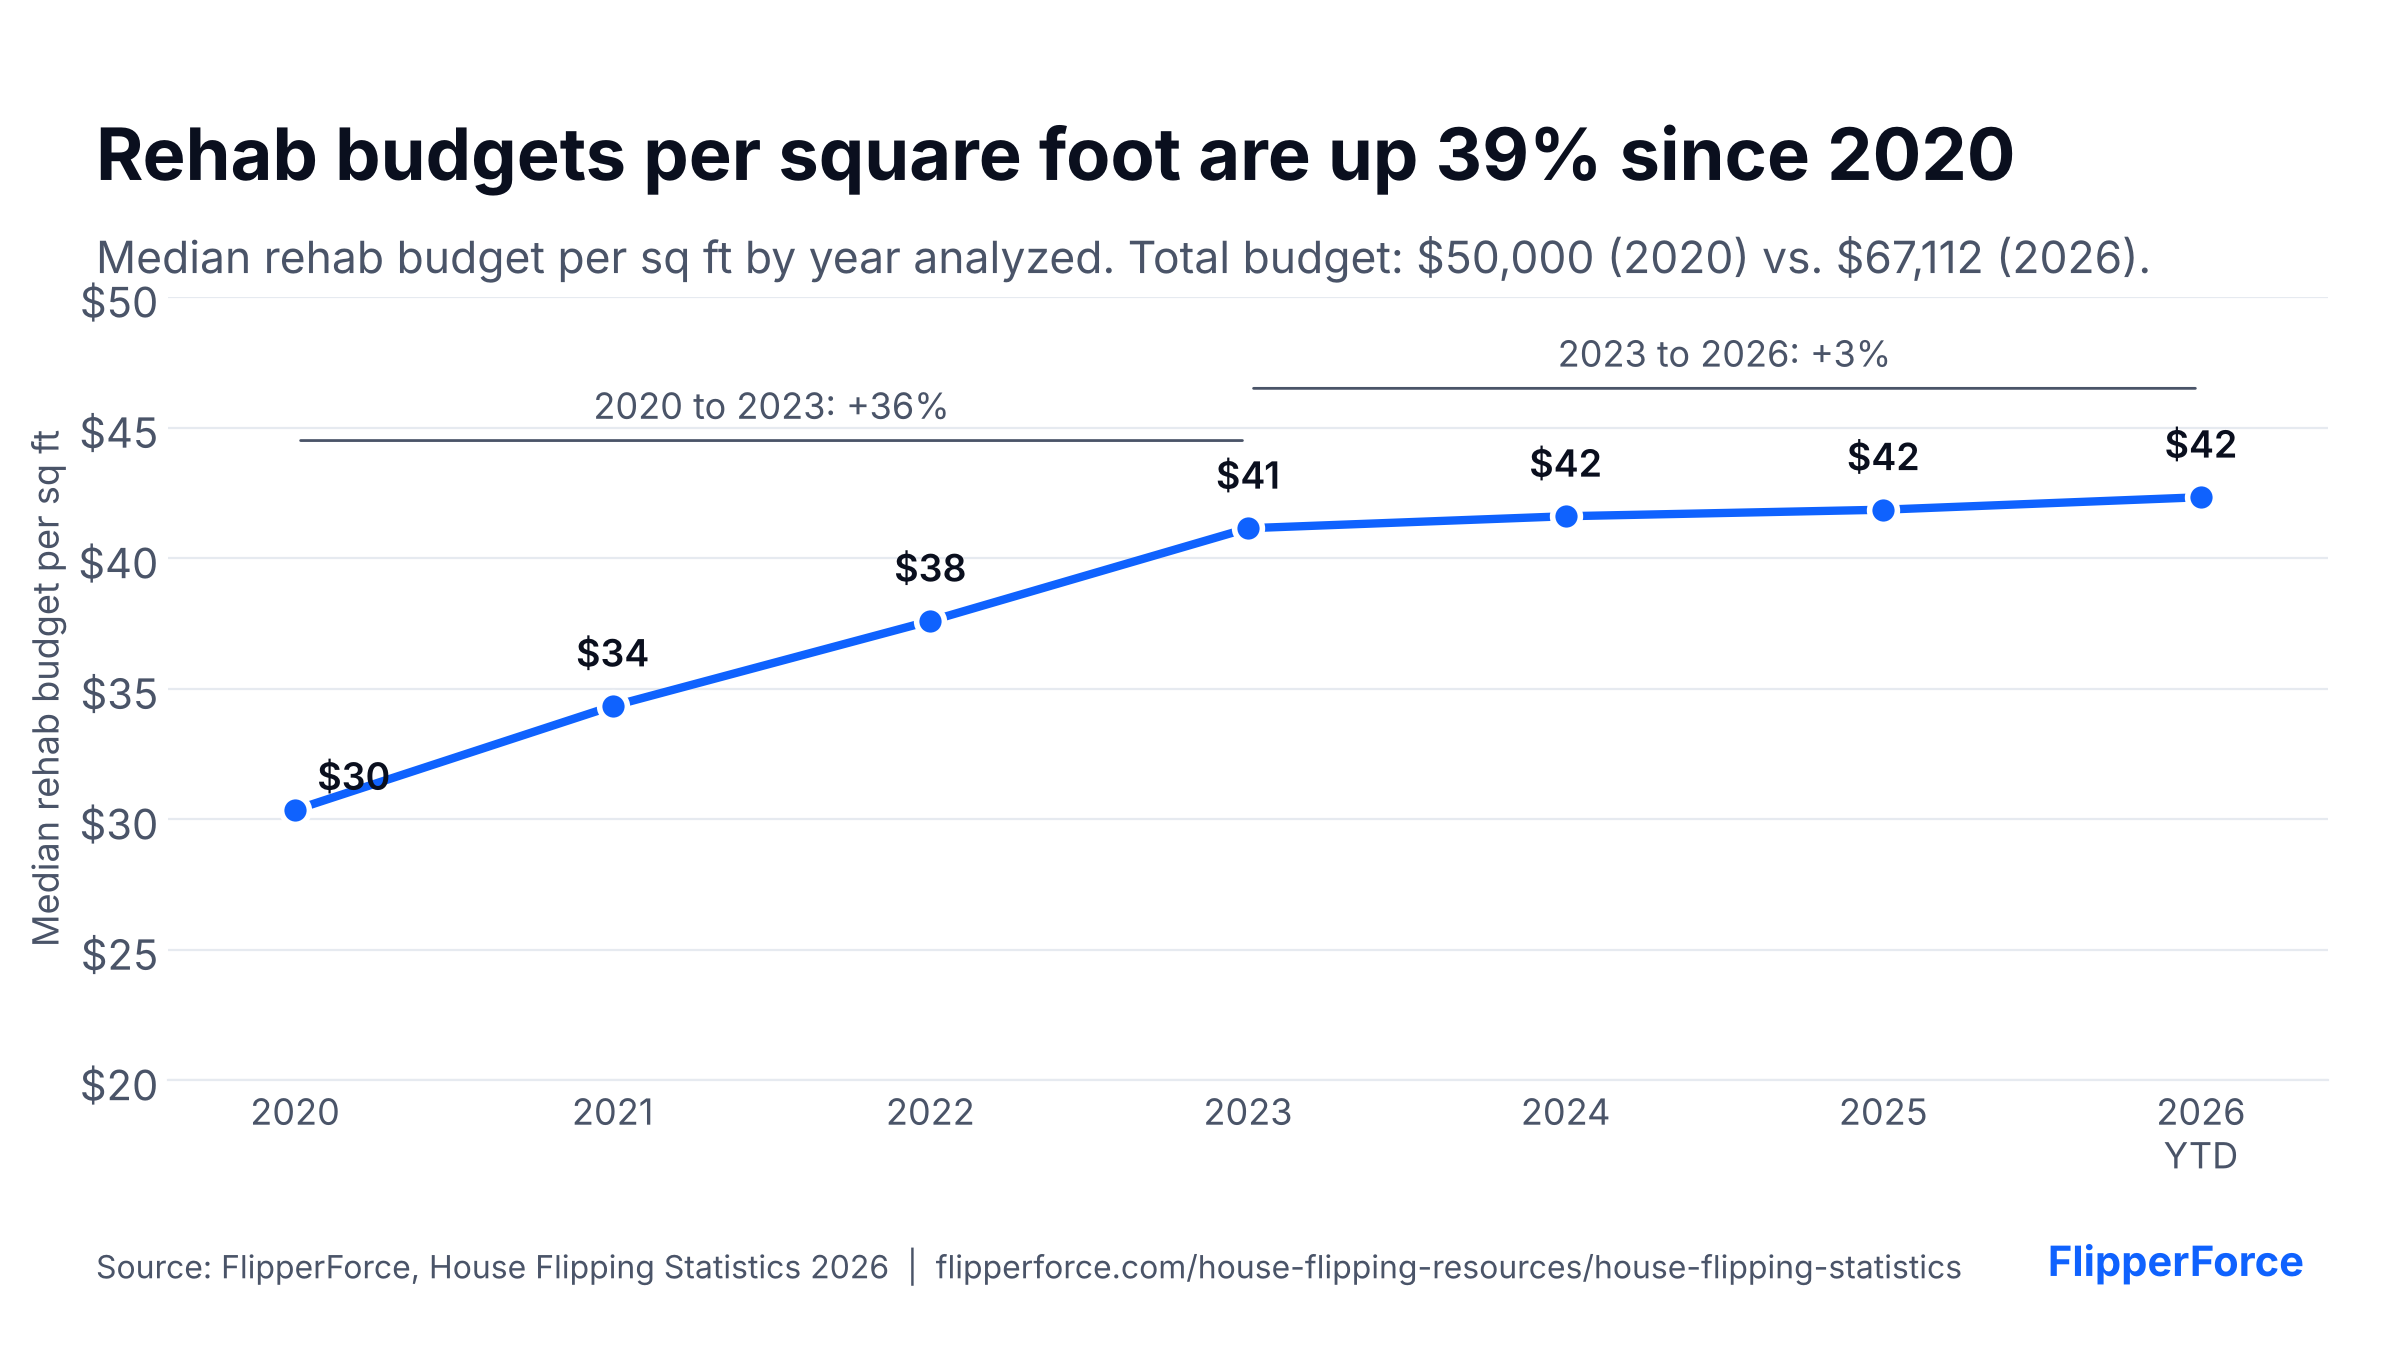
The median rehab budget per square foot climbed from $30 in 2020 to $42 in 2026, a 39% increase. In total dollars, the median rehab budget went from $50,000 to $67,112. Trend figures group deals by the year each one was analyzed in FlipperForce, with the same 10-deals-per-account limit. 2026 is year to date through early October.
Free to use with credit. Paste this code into your site:
Almost all of that increase happened in three years. Rehab budgets rose 36% per square foot from 2020 to 2023, then just 3% from 2023 to 2026. We believe this tracks the inflation that hit construction after 2020: materials, appliances, and skilled labor all got more expensive at the same time, and those prices have not come back down. Costs have leveled off at a higher floor, which means an investor still estimating rehabs from 2020 numbers is underbudgeting by close to 30%.
Year analyzed
Median rehab per sq ft
Median rehab budget
2020
$30
$50,000
2021
$34
$54,279
2022
$38
$60,000
2023
$41
$60,000
2024
$42
$65,000
2025
$42
$65,000
2026 (YTD)
$42
$67,112
Source: FlipperForce analysis of fix-and-flip deals by the year each deal was analyzed. 2026 is year to date through early October.
How Often Do House Flips Go Over Budget?
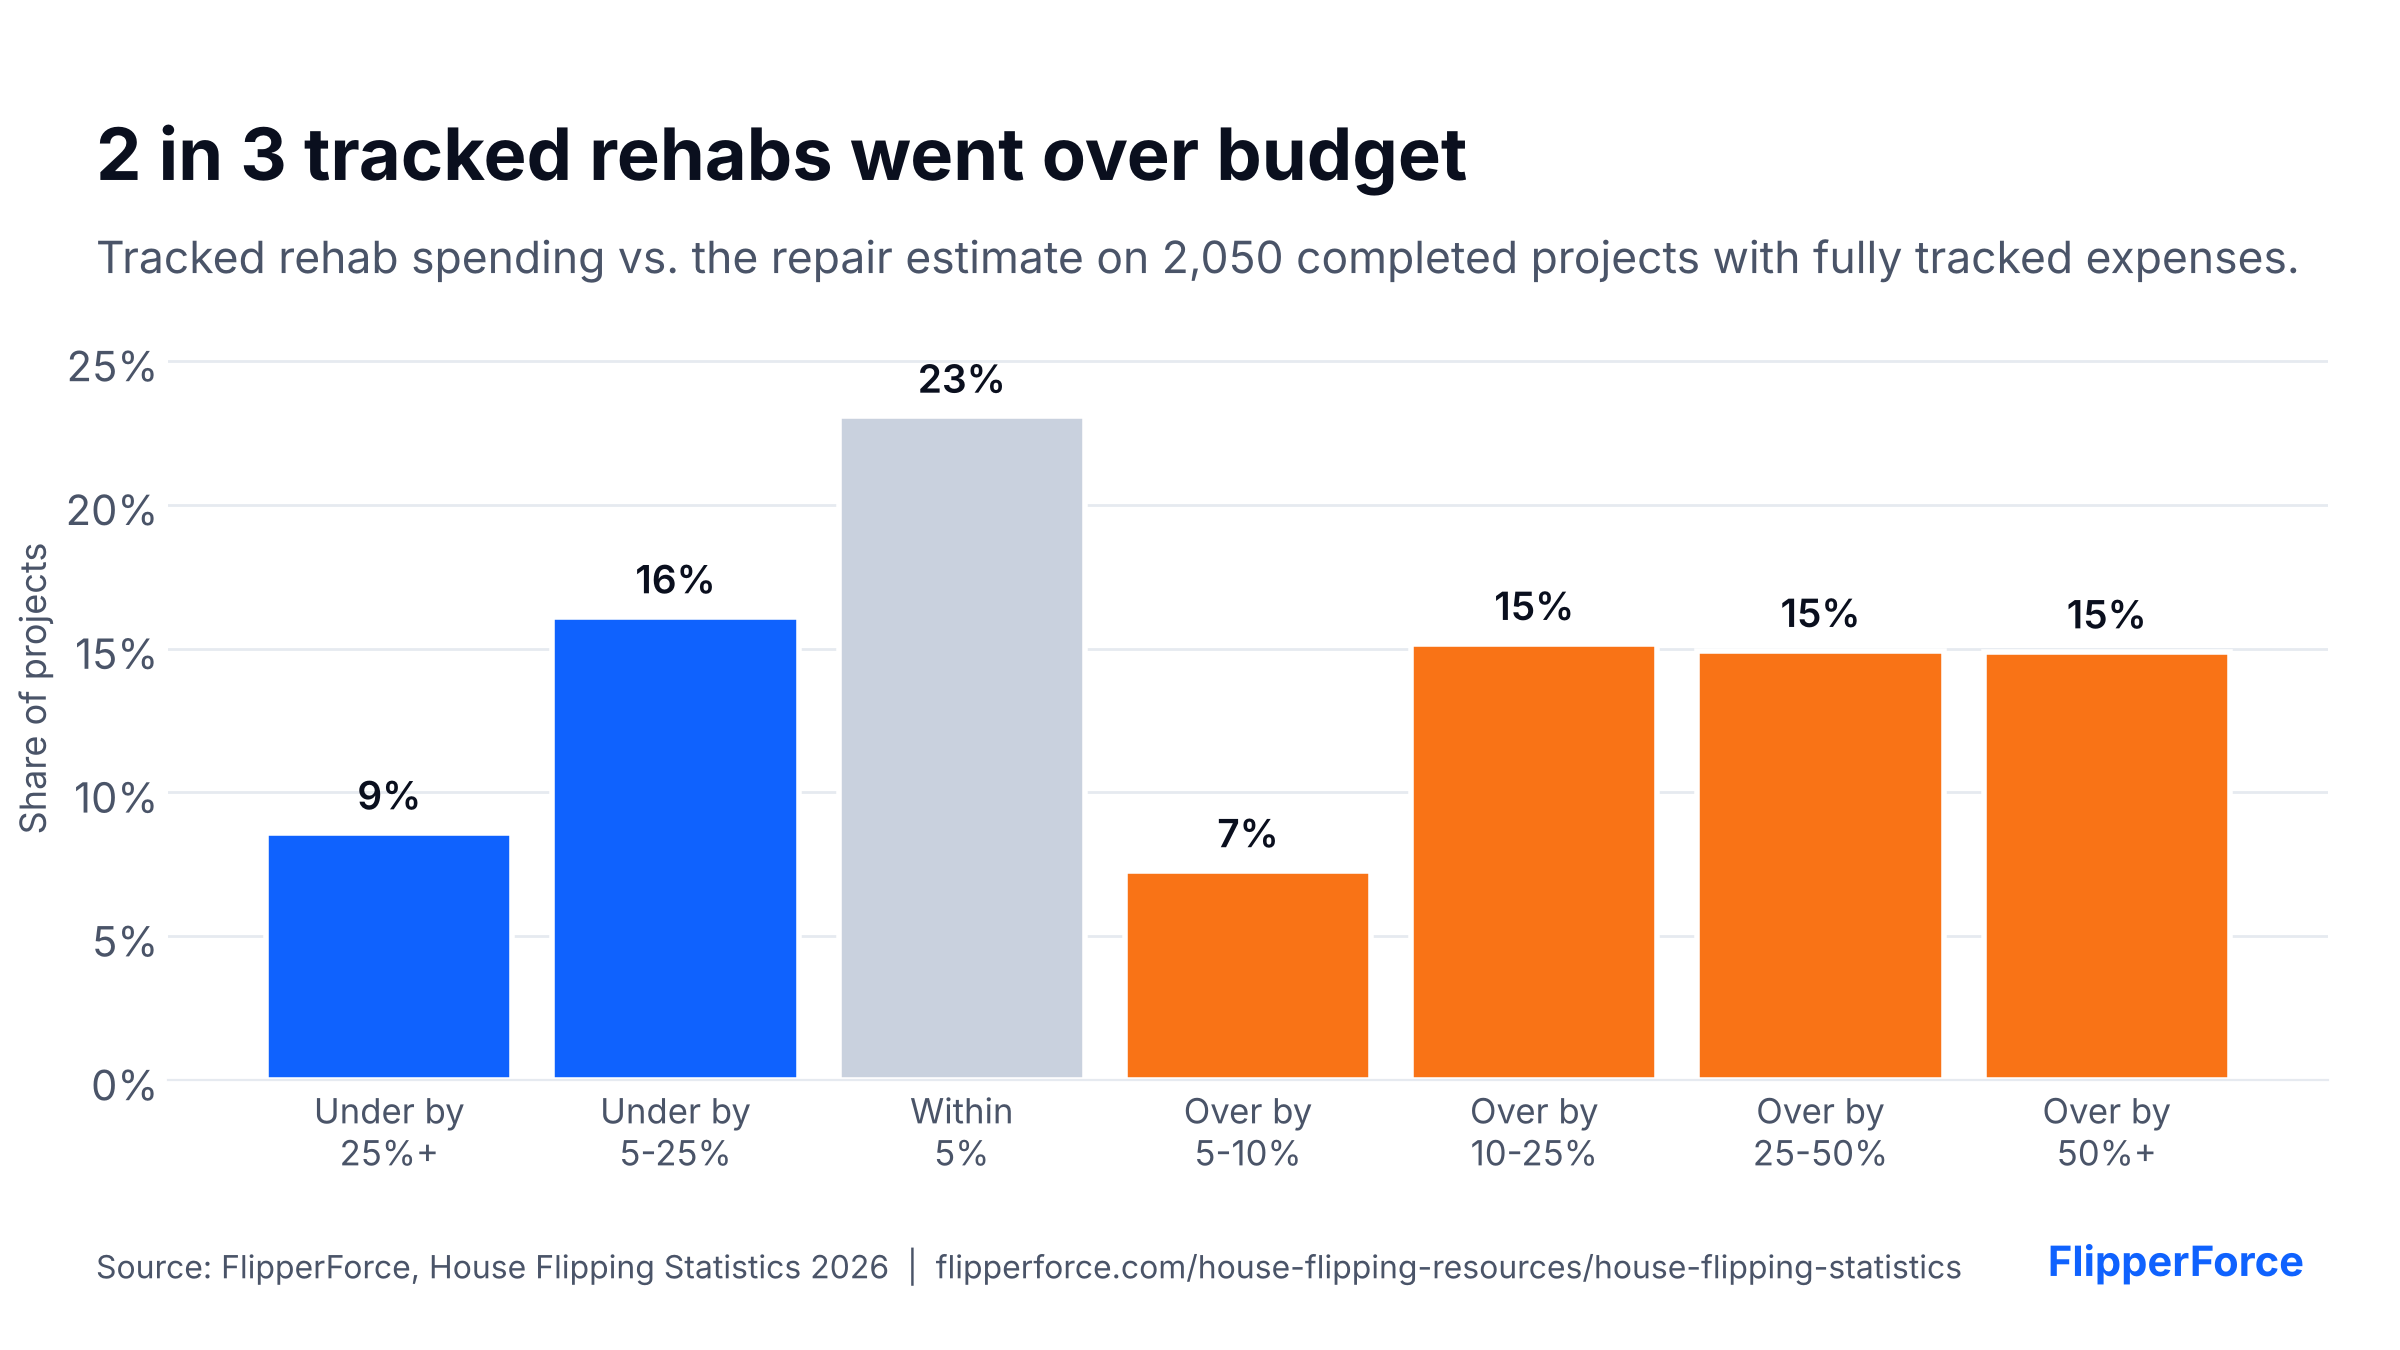
Most of the time. To answer this, we isolated completed rehabs where the investor logged at least 10 rehab expenses against the original estimate: 2,050 projects from 577 investor accounts passed that bar. Of those, 64.9% finished over their original repair estimate. 45.0% went over by more than 10%, and 29.8% went over by 25% or more. When a project went over, the average overrun was $37,466.
Free to use with credit. Paste this code into your site:
The typical project finished about 6% over its estimate. The bigger risk is in the tail: roughly 3 in 10 projects blow past the estimate by a quarter or more. When a project does go over, the average overrun ($37,466) eats up most of the median projected profit on a flip ($45,100).
Outcome vs. repair estimate
Share of completed rehabs
Finished over the estimate
64.9%
Over by more than 10%
45.0%
Over by 25% or more
29.8%
Under by 5% or more
24.7%
Median result vs. estimate
6.4% over
Average overrun when over budget
$37,466
Source: FlipperForce analysis of completed rehabs with fully tracked expenses (2,050 projects from 577 accounts meeting the criteria), comparing tracked spending to the project's repair estimate.
How Much Profit Does the Average House Flip Make?
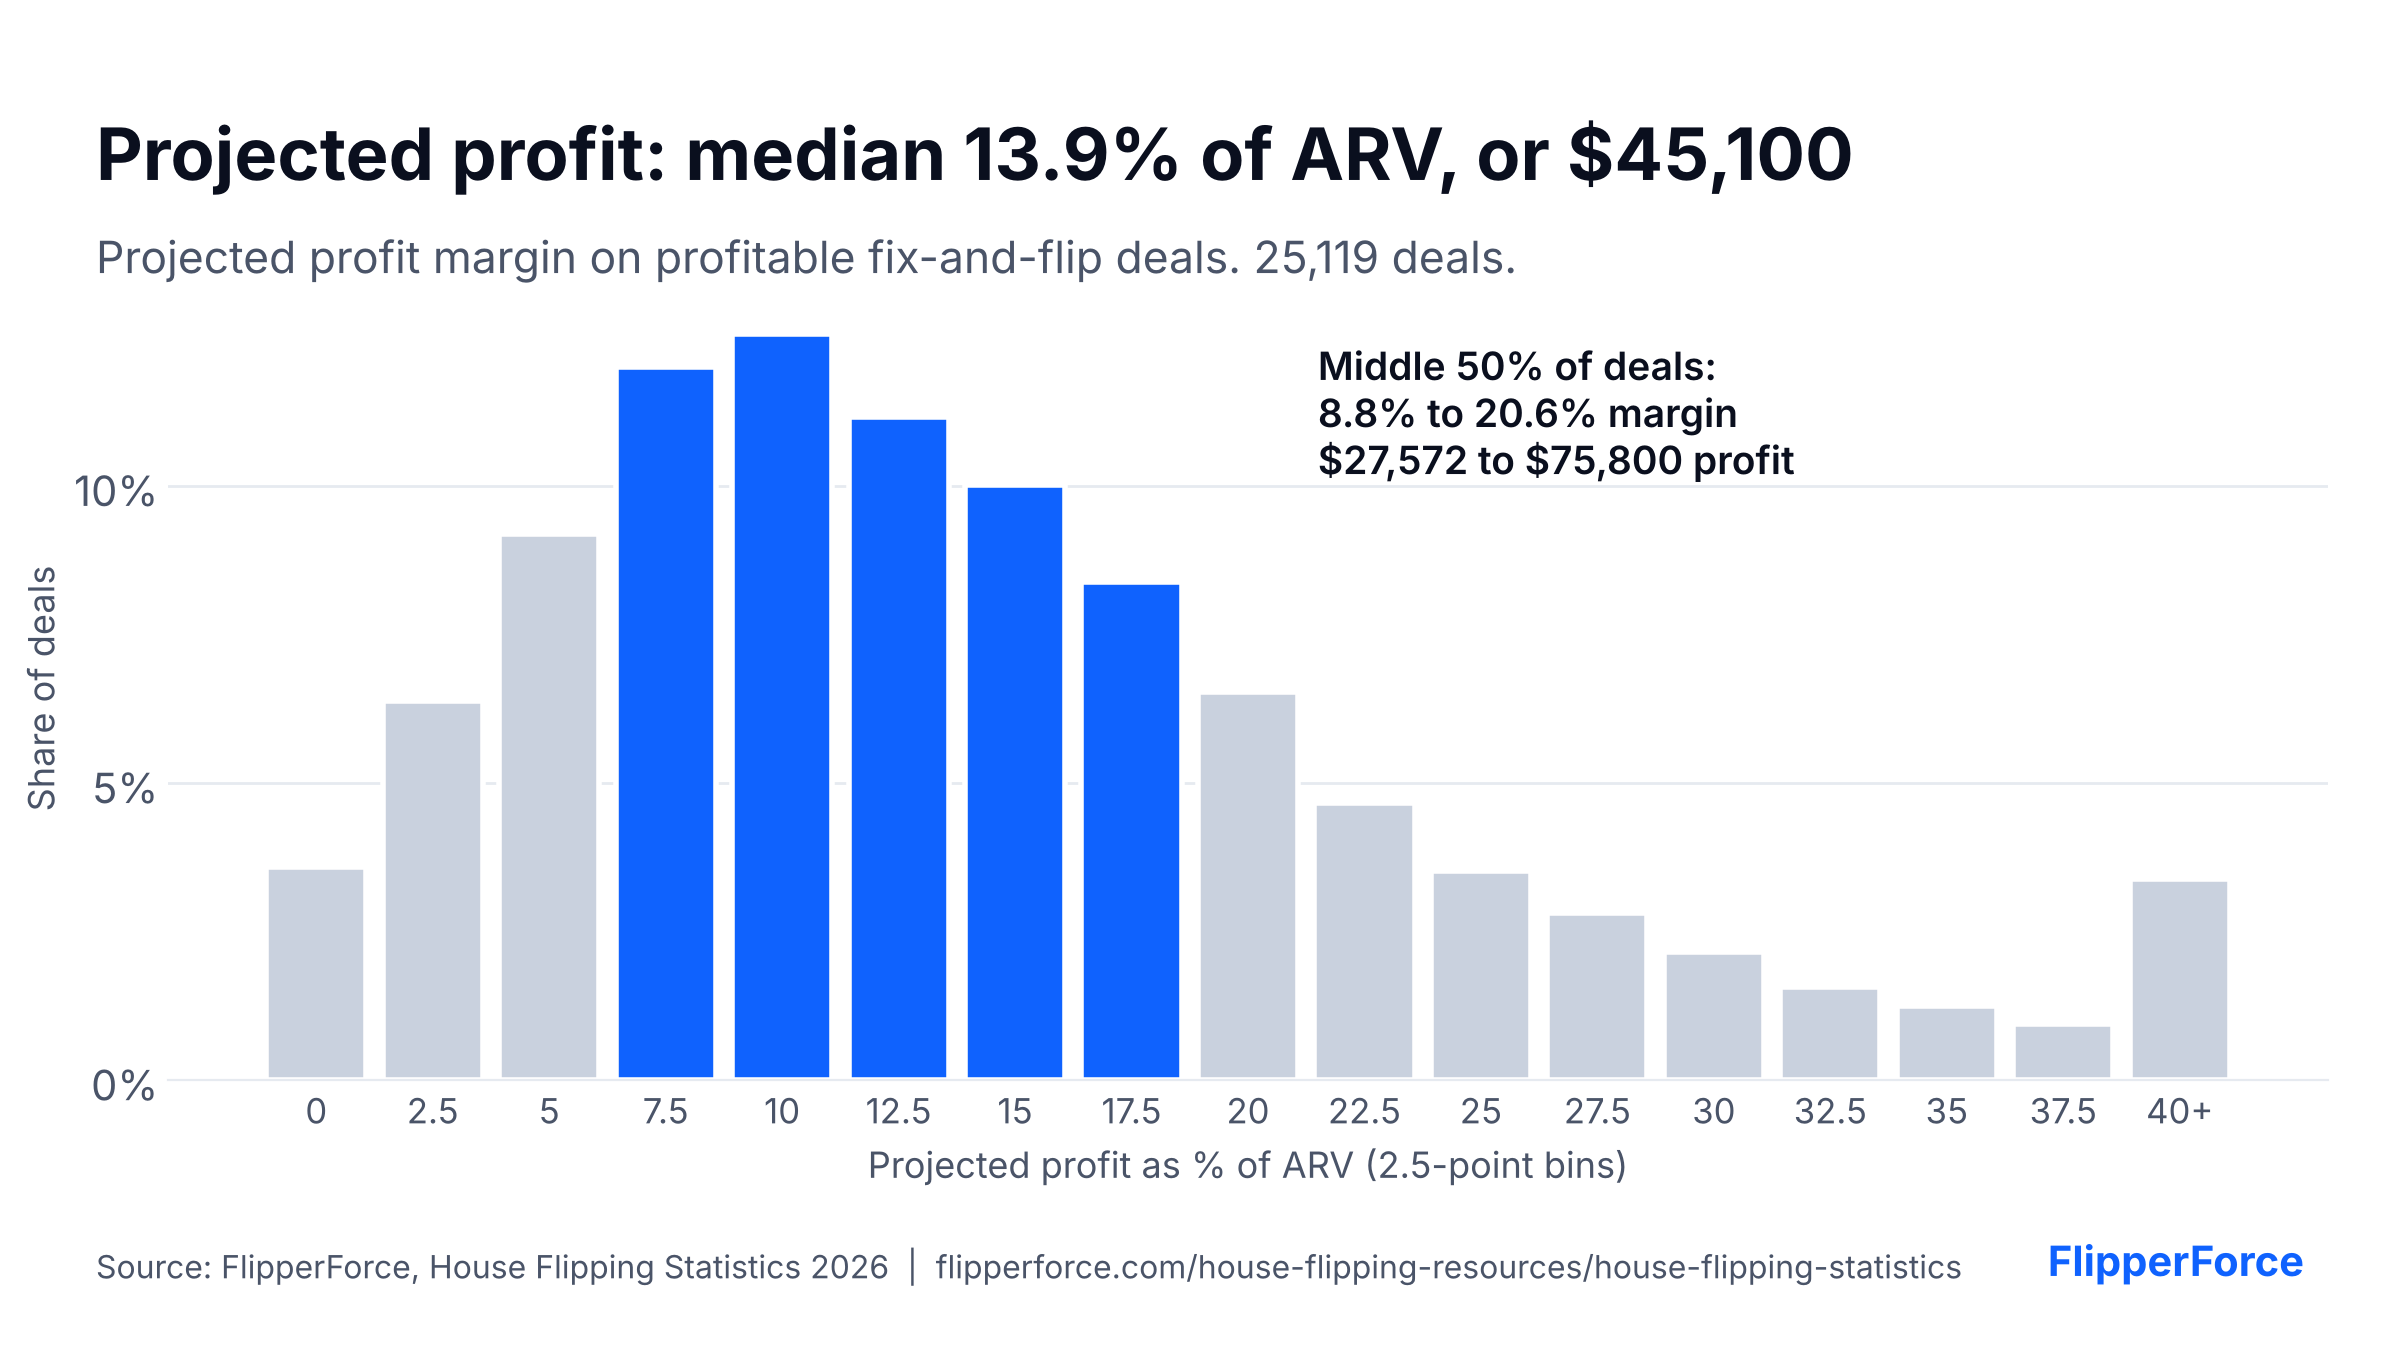
The median fix-and-flip deal projects $45,100 in profit and a 13.9% margin on ARV, based on 25,119 deals. Half of deals project between $27,572 and $75,800 in profit. The average is higher, $75,647, because a small number of high-value projects pull it up.
Free to use with credit. Paste this code into your site:
How Have Profit Margins Changed Over Time?
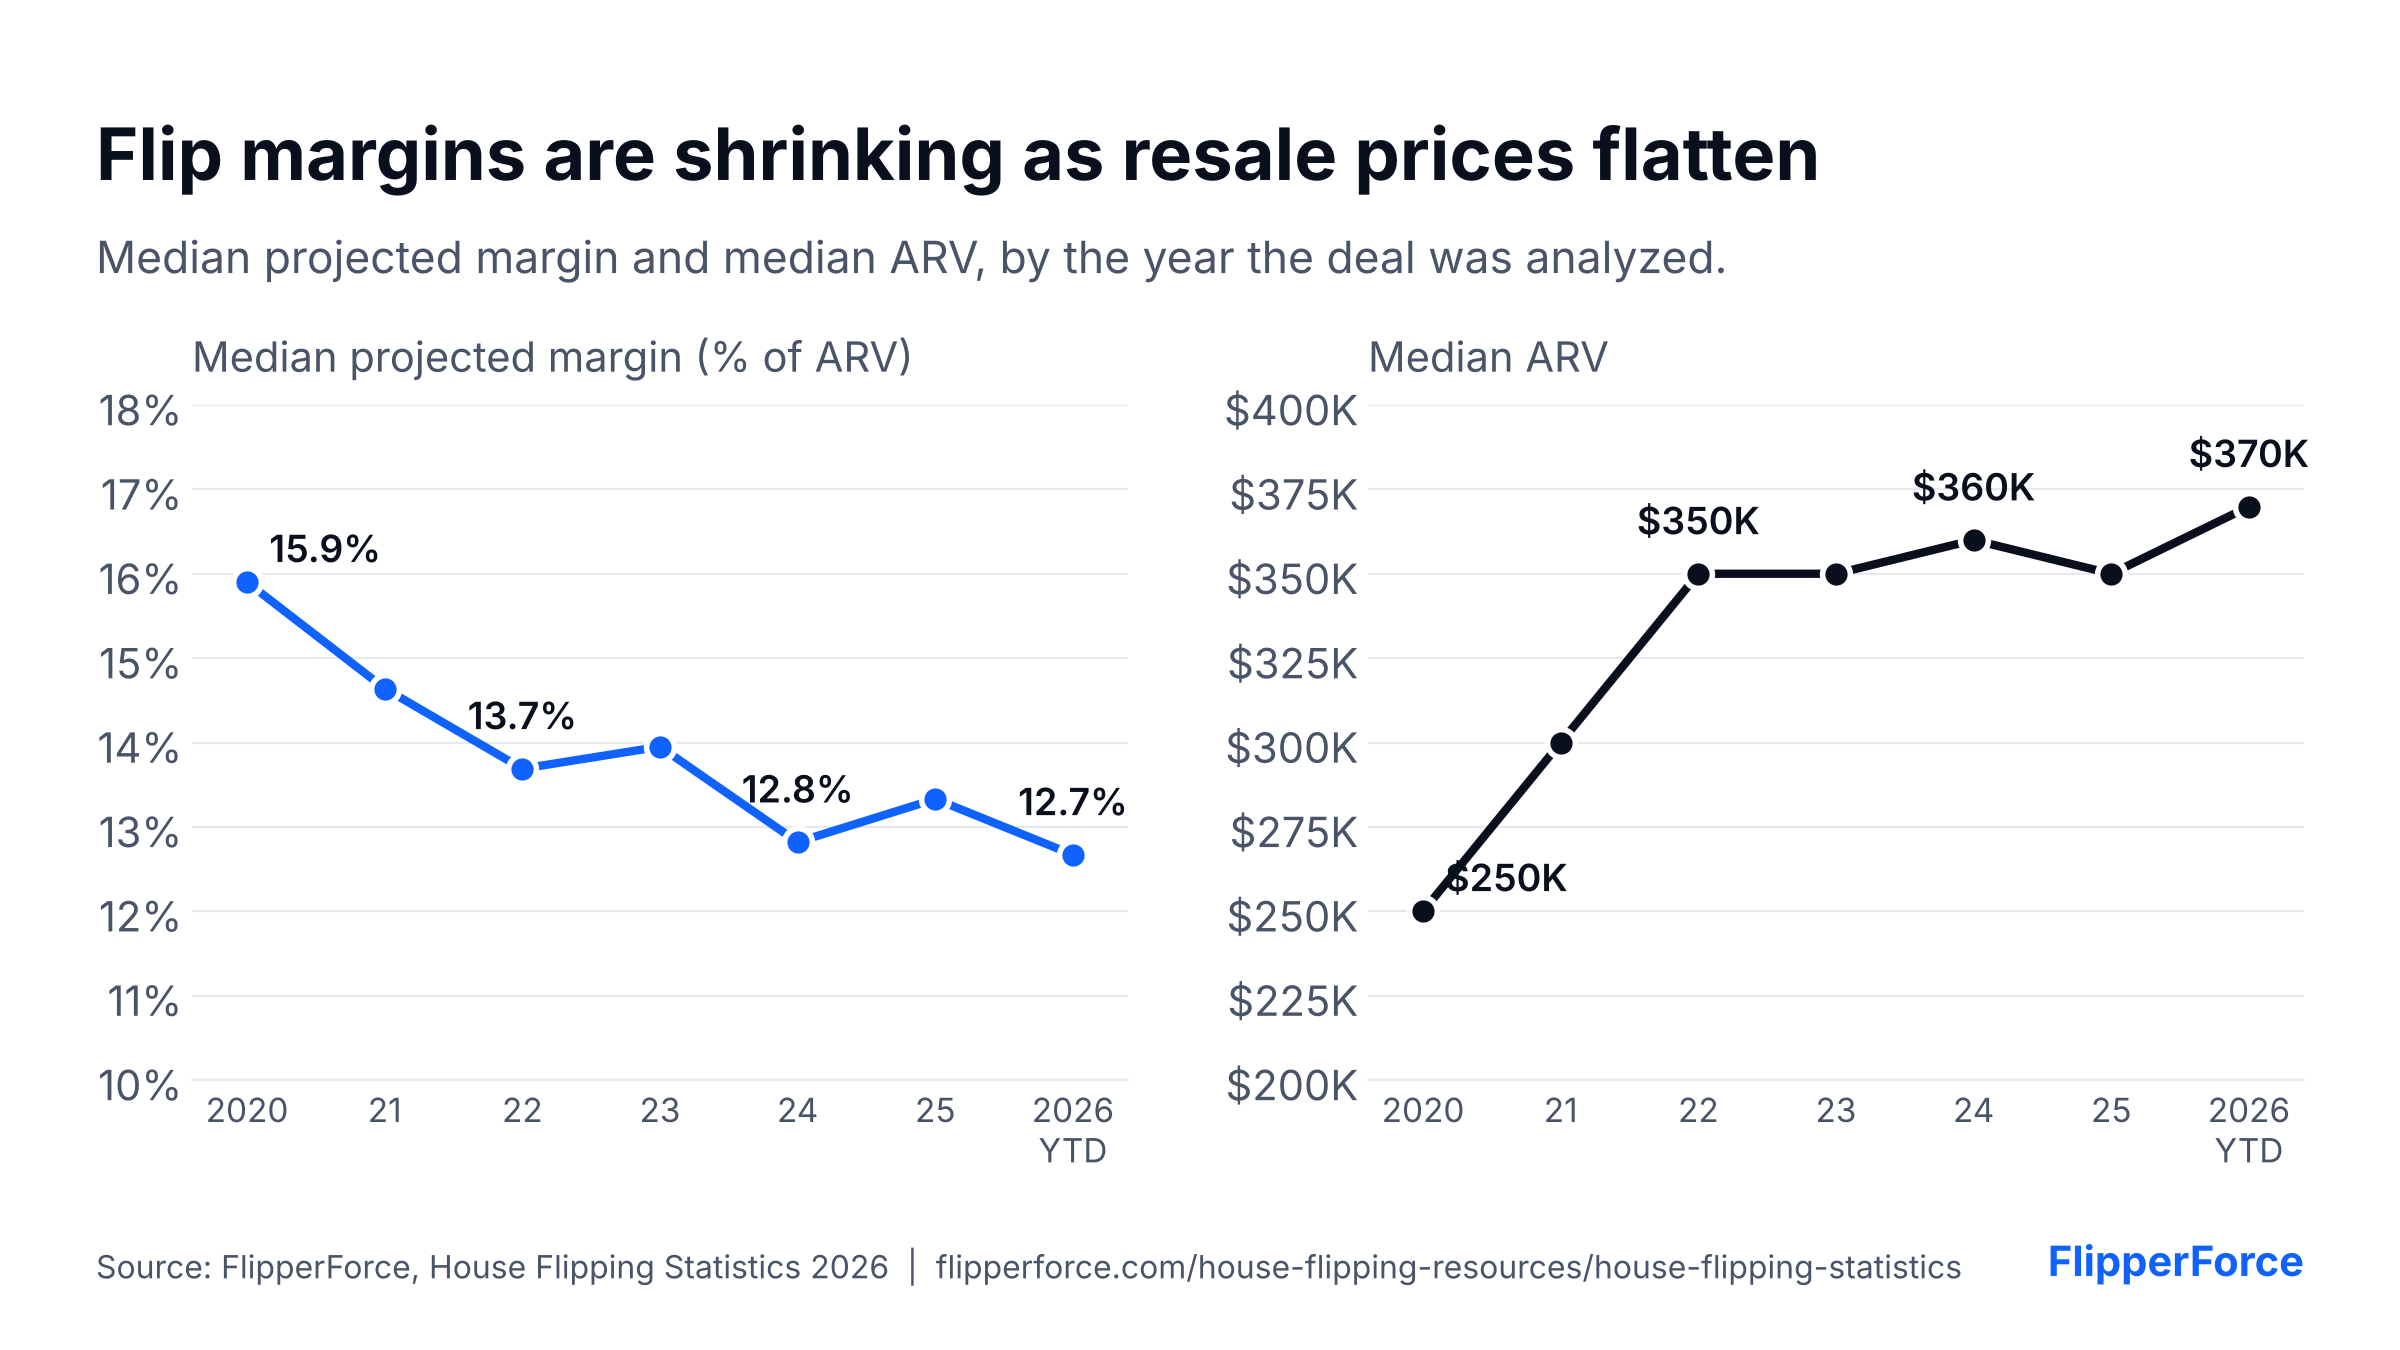
The median projected margin fell from 15.9% of ARV in 2020 to 12.7% in 2026. Median profit in dollars peaked at $48,788 in 2023 and is $44,722 so far in 2026. Trend figures group deals by the year each one was analyzed in FlipperForce, with the same 10-deals-per-account limit. 2026 is year to date through early October.
Free to use with credit. Paste this code into your site:
The squeeze came in two waves. From 2020 to 2022, margins fell fastest, from 15.9% to 13.7%. ARVs were rising quickly then, from $250,000 to $350,000, but competition for houses pushed the median purchase price even faster, from $135,000 to $195,000, while rehab costs climbed with inflation.
Since 2022, the pressure has shifted. Resale prices stopped climbing: the median ARV has stayed between $350,000 and $370,000. Rehab budgets kept edging up, and now take up 18.5% of ARV, up from 16.7% in 2022. Selling costs crept up as concessions grew. With costs still rising and resale prices flat, margins slid another point, to 12.7% in 2026. When costs keep climbing and ARVs don't, the margin is what gives.
Year analyzed
Median ARV
Median purchase price
Median margin (% of ARV)
Median projected profit
2020
$250,000
$135,000
15.9%
$40,450
2021
$300,000
$170,000
14.6%
$43,772
2022
$350,000
$195,000
13.7%
$46,825
2023
$350,000
$200,000
14.0%
$48,788
2024
$360,000
$206,250
12.8%
$44,543
2025
$350,000
$190,000
13.3%
$45,150
2026 (YTD)
$369,900
$205,000
12.7%
$44,722
Source: FlipperForce analysis of fix-and-flip deals by the year each deal was analyzed. 2026 is year to date through early October.
Do Real Flippers Follow the 70% Rule?
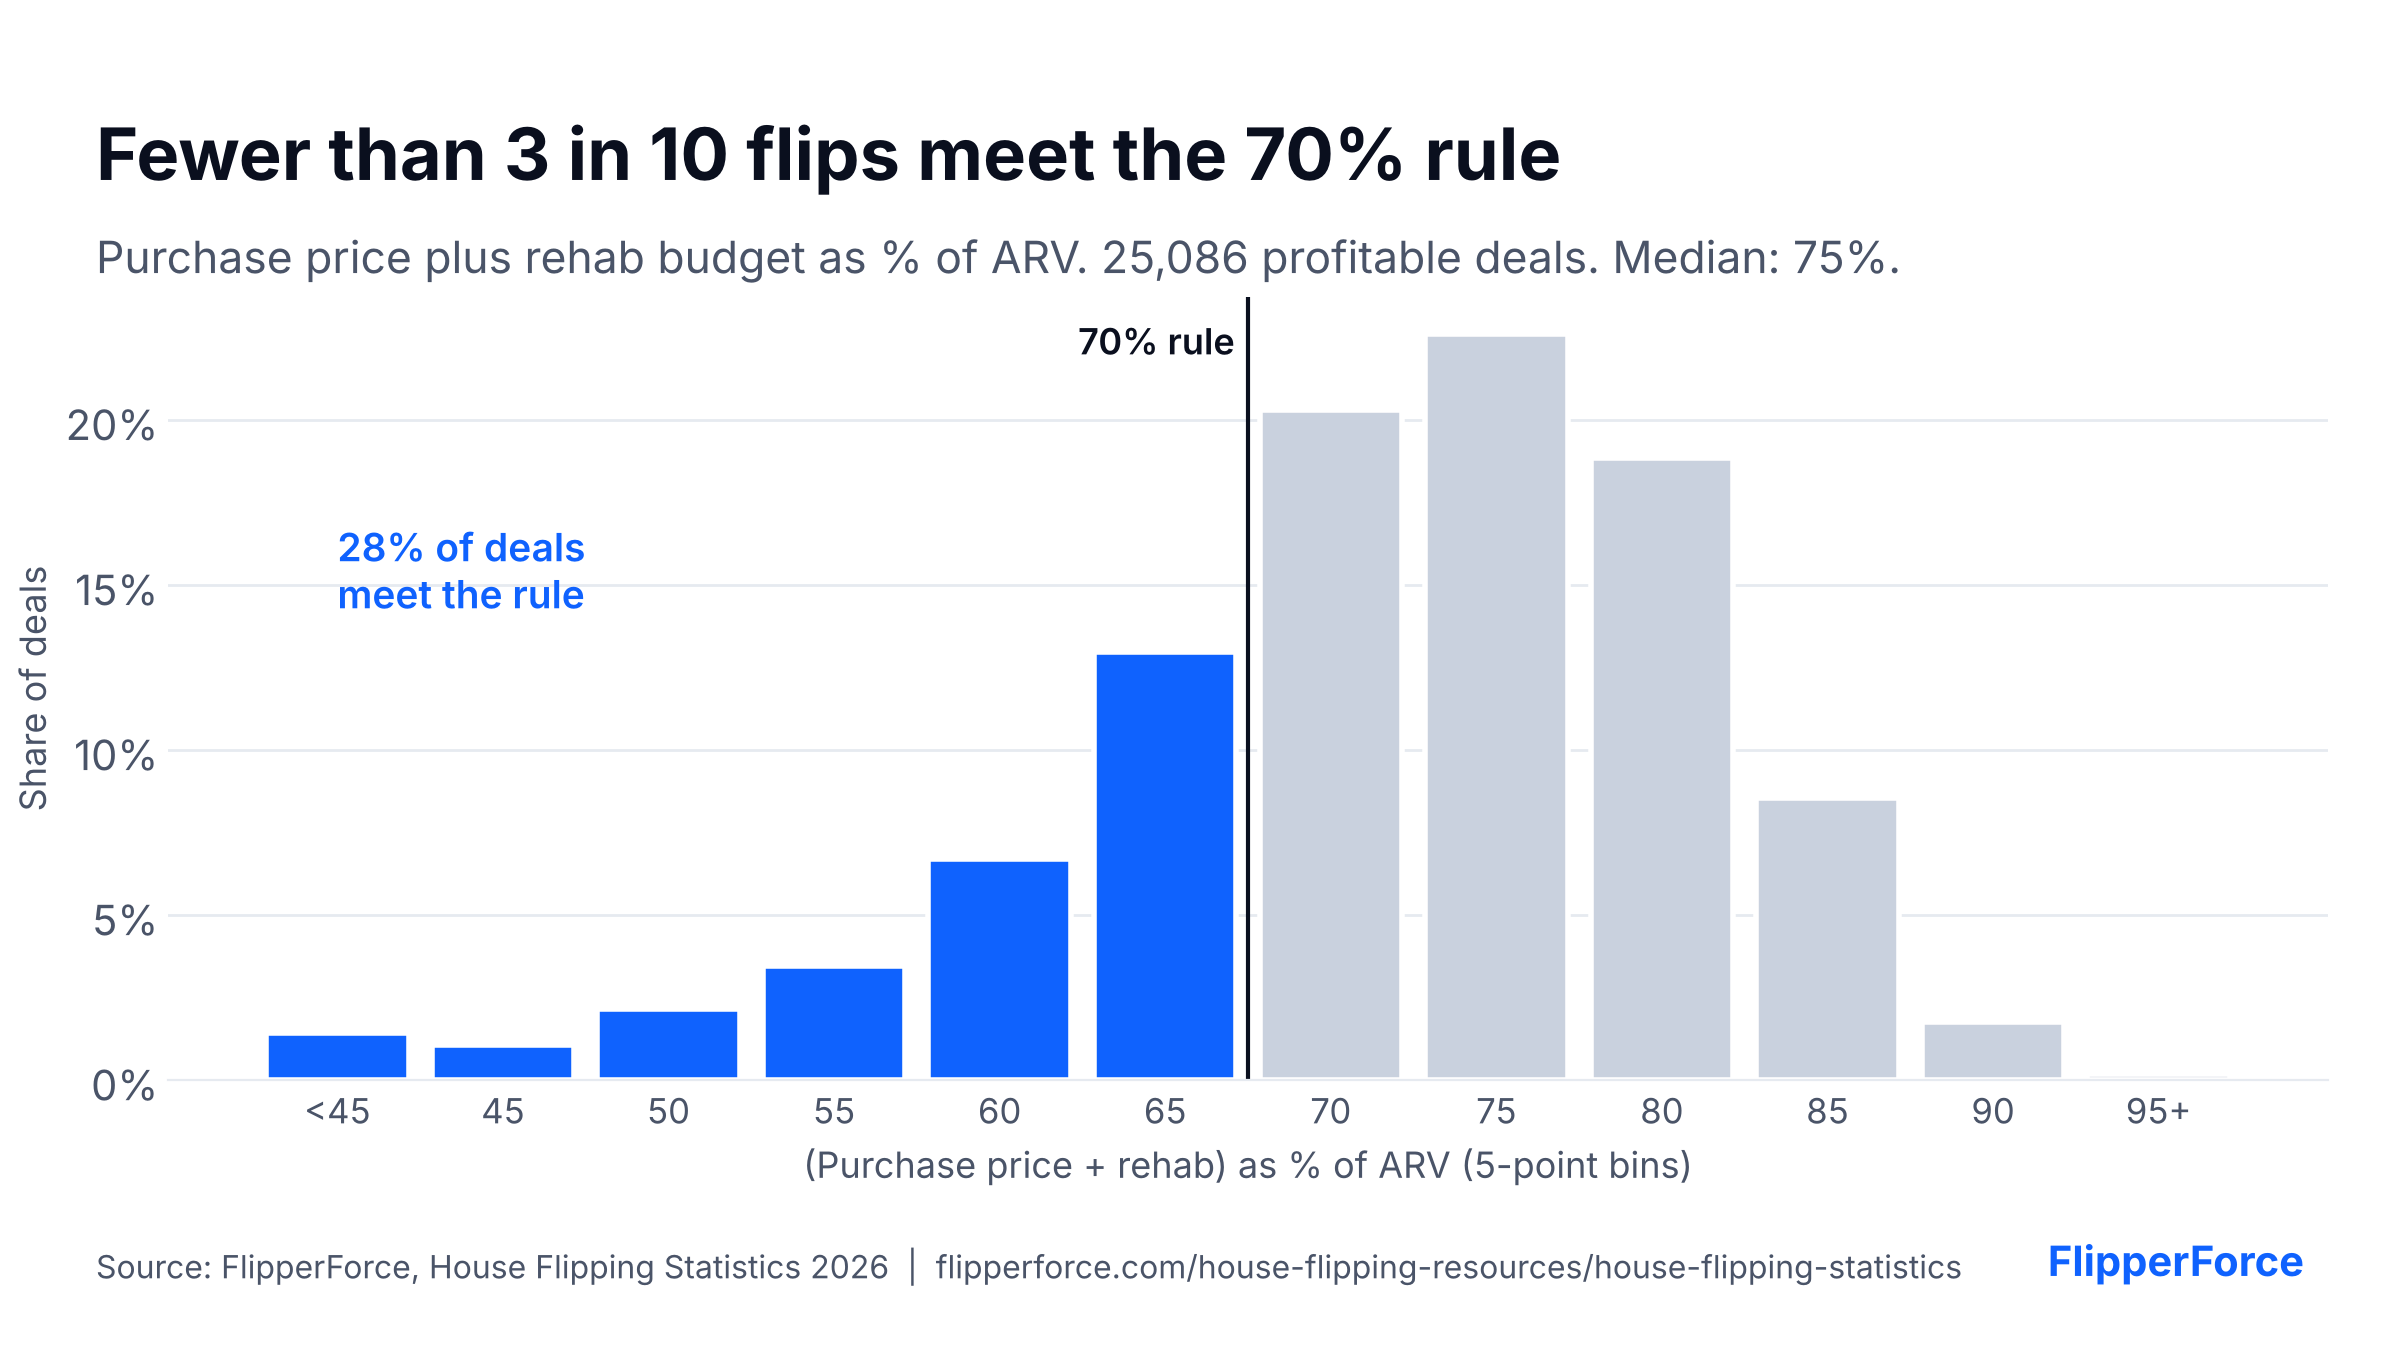
Mostly, no. Fewer than 3 in 10 profitable flips analyzed in FlipperForce (27.8%) meet the 70% rule, which says purchase price plus repairs should not exceed 70% of ARV. Across 25,086 deals, the median investor paid 75% of ARV for purchase plus rehab combined, with half of deals between 69.2% and 80.9%.
Free to use with credit. Paste this code into your site:
This does not mean the rule is wrong. It means most investors are accepting thinner margins than the rule implies, which makes accurate rehab budgets and holding cost estimates more important, not less.
How Long Does It Take to Flip a House?
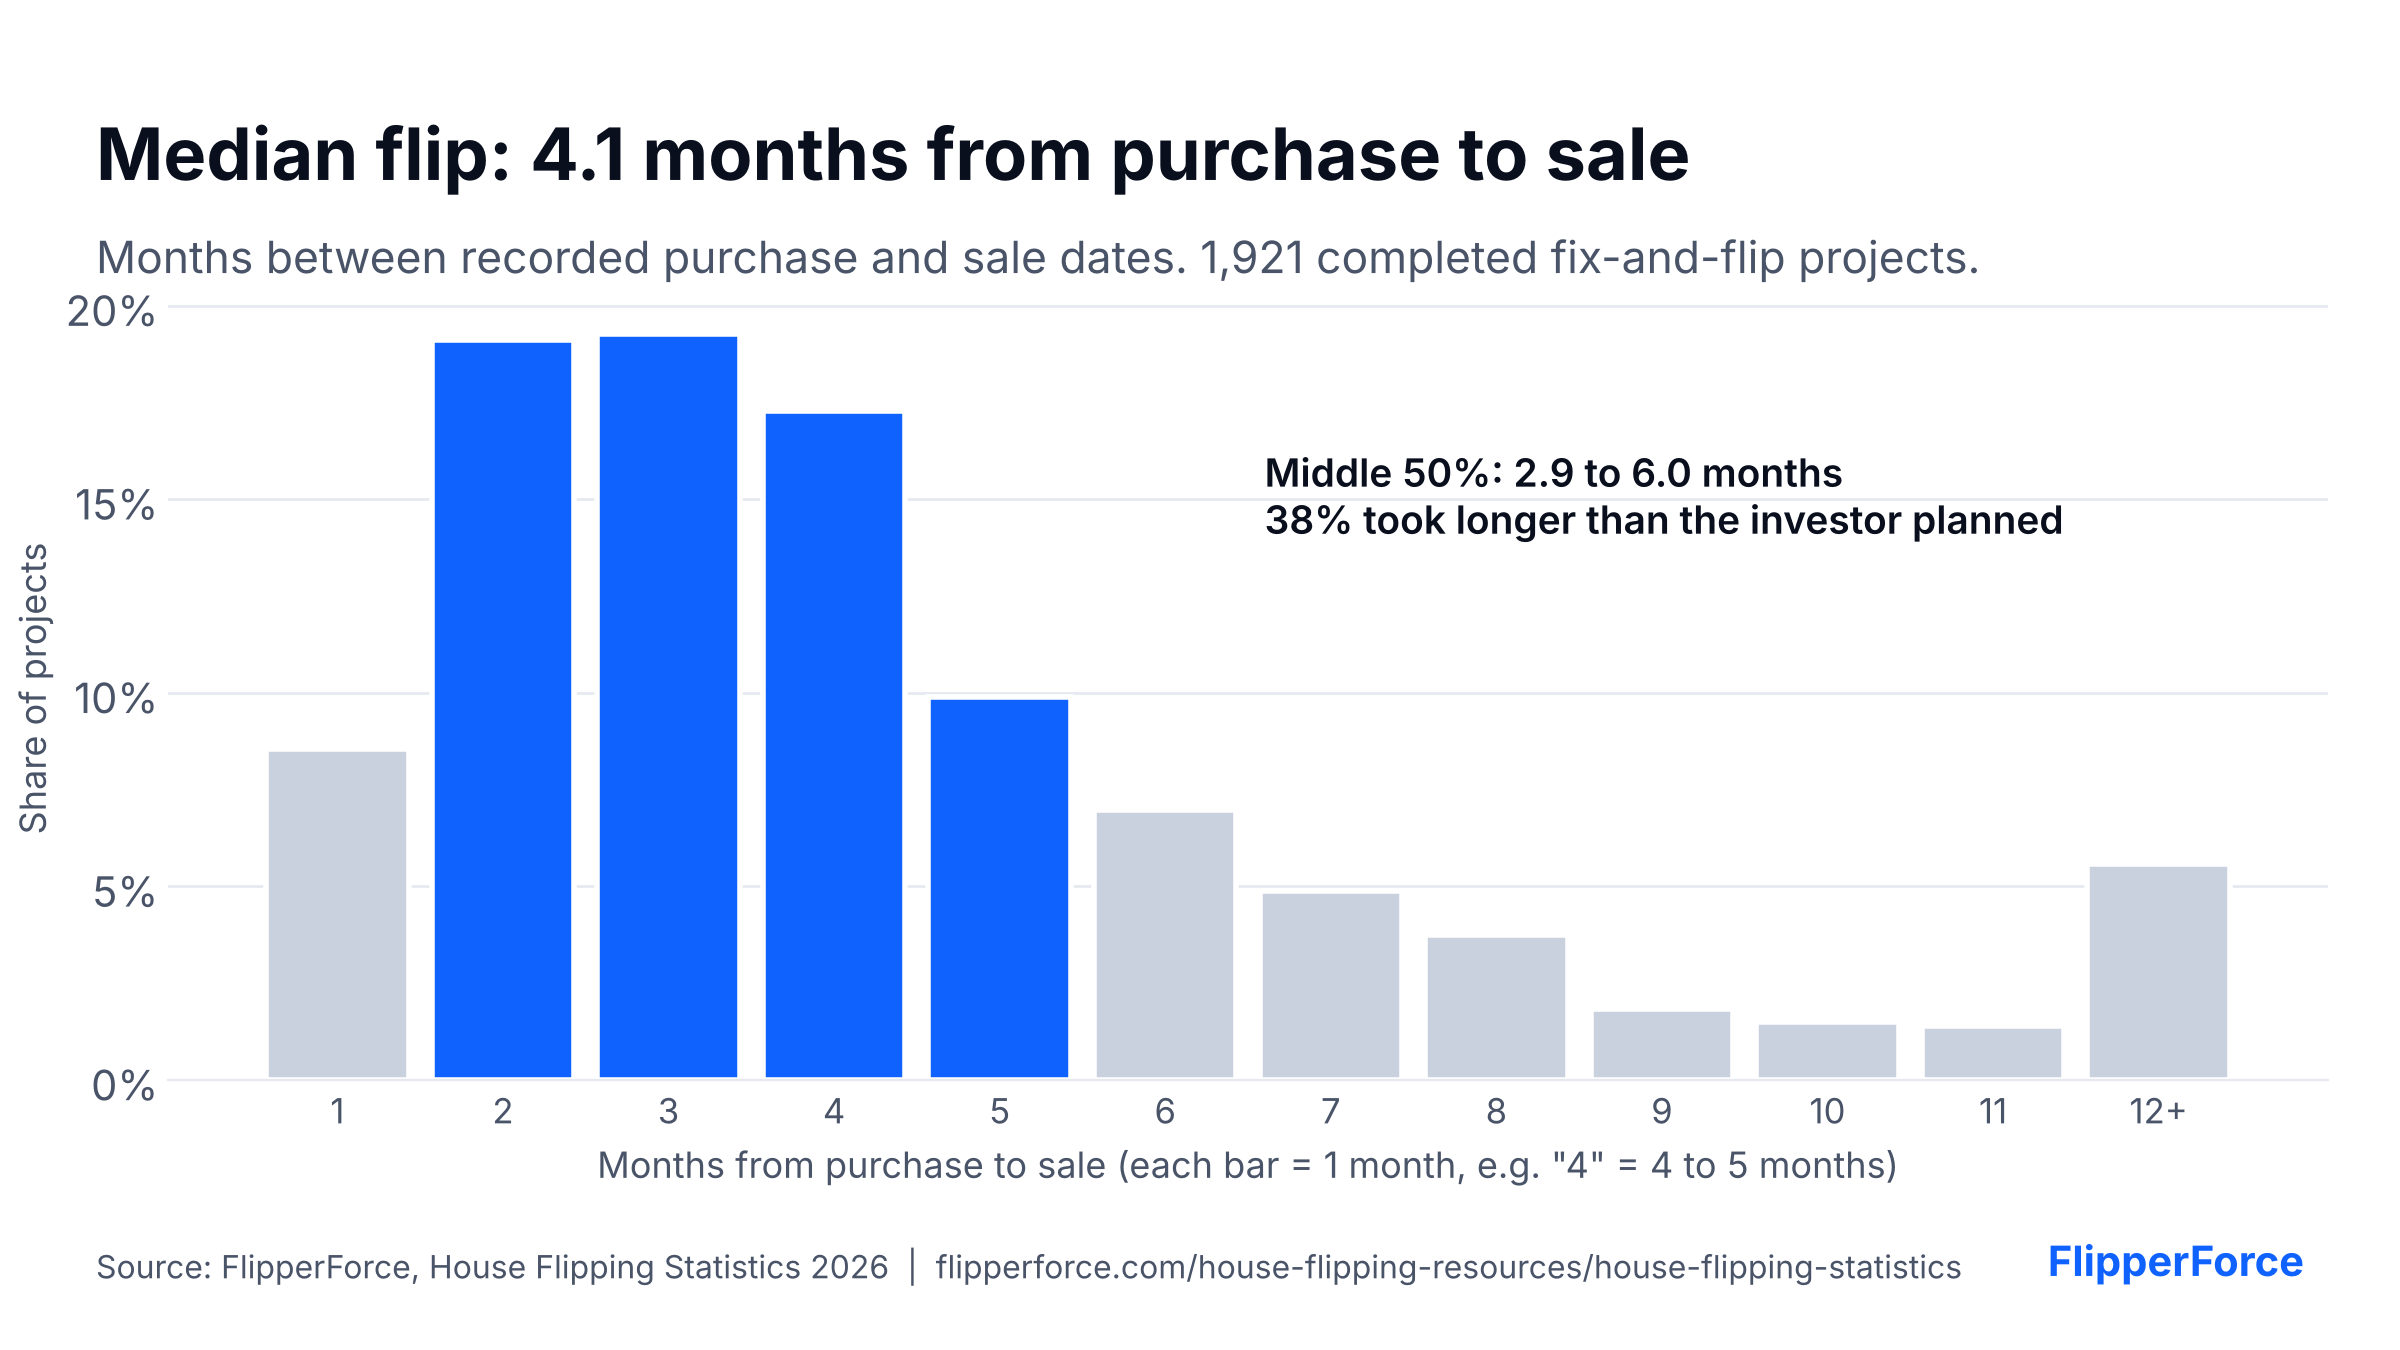
The median completed flip took 4.1 months from purchase to sale, based on the 1,921 flips where the investor recorded both a purchase date and a sale date. Half took between 2.9 and 6.0 months. When planning, the median investor budgets 5 months of holding costs, and 38% of projects ran longer than the investor's plan.
Free to use with credit. Paste this code into your site:
The median holding cost budget is $592 per month (typical range $378 to $1,000), covering loan interest, taxes, insurance, and utilities.
How Do Most Flippers Finance Their Deals?
69.6% of fix-and-flip deals analyzed in FlipperForce use financing, such as hard money or private money loans. 25.0% are bought with cash, and 5.3% did not specify. Cash deals project an average margin of 19.5% of ARV, compared with 14.3% for financed deals, likely in part because financed deals carry interest and points.
Free to use with credit. Paste this code into your site:
State
Deals
Buying costs (% of price)
Median rehab per sq ft
Profit margin (% of ARV)
Avg. projected profit
Texas
2,918
2.65%
$30
15.3%
$65,289
California
2,605
2.05%
$60
12.3%
$133,790
Florida
2,513
2.93%
$38
15.4%
$72,753
Georgia
1,193
2.99%
$39
16.3%
$62,896
Ohio
1,189
3.22%
$34
18.2%
$40,024
Virginia
1,043
2.98%
$37
15.2%
$52,355
North Carolina
1,005
2.80%
$38
16.4%
$49,227
New Jersey
720
2.93%
$48
16.3%
$93,505
Pennsylvania
709
4.08%
$45
18.6%
$61,933
Maryland
703
4.12%
$46
17.6%
$69,606
Colorado
689
1.56%
$41
11.5%
$73,937
Tennessee
618
2.71%
$34
17.5%
$60,775
Illinois
573
3.28%
$39
19.8%
$61,437
Arizona
562
2.06%
$33
13.0%
$81,161
Missouri
541
2.79%
$32
17.8%
$43,802
Indiana
530
3.11%
$34
19.1%
$42,377
South Carolina
493
3.08%
$36
16.9%
$54,954
Michigan
478
2.77%
$36
20.1%
$57,229
Washington
465
2.12%
$40
14.2%
$90,313
New York
462
3.30%
$50
16.4%
$123,602
Alabama
453
3.13%
$31
20.5%
$57,088
Massachusetts
384
2.24%
$79
15.7%
$227,482
Oklahoma
304
3.14%
$29
18.2%
$41,010
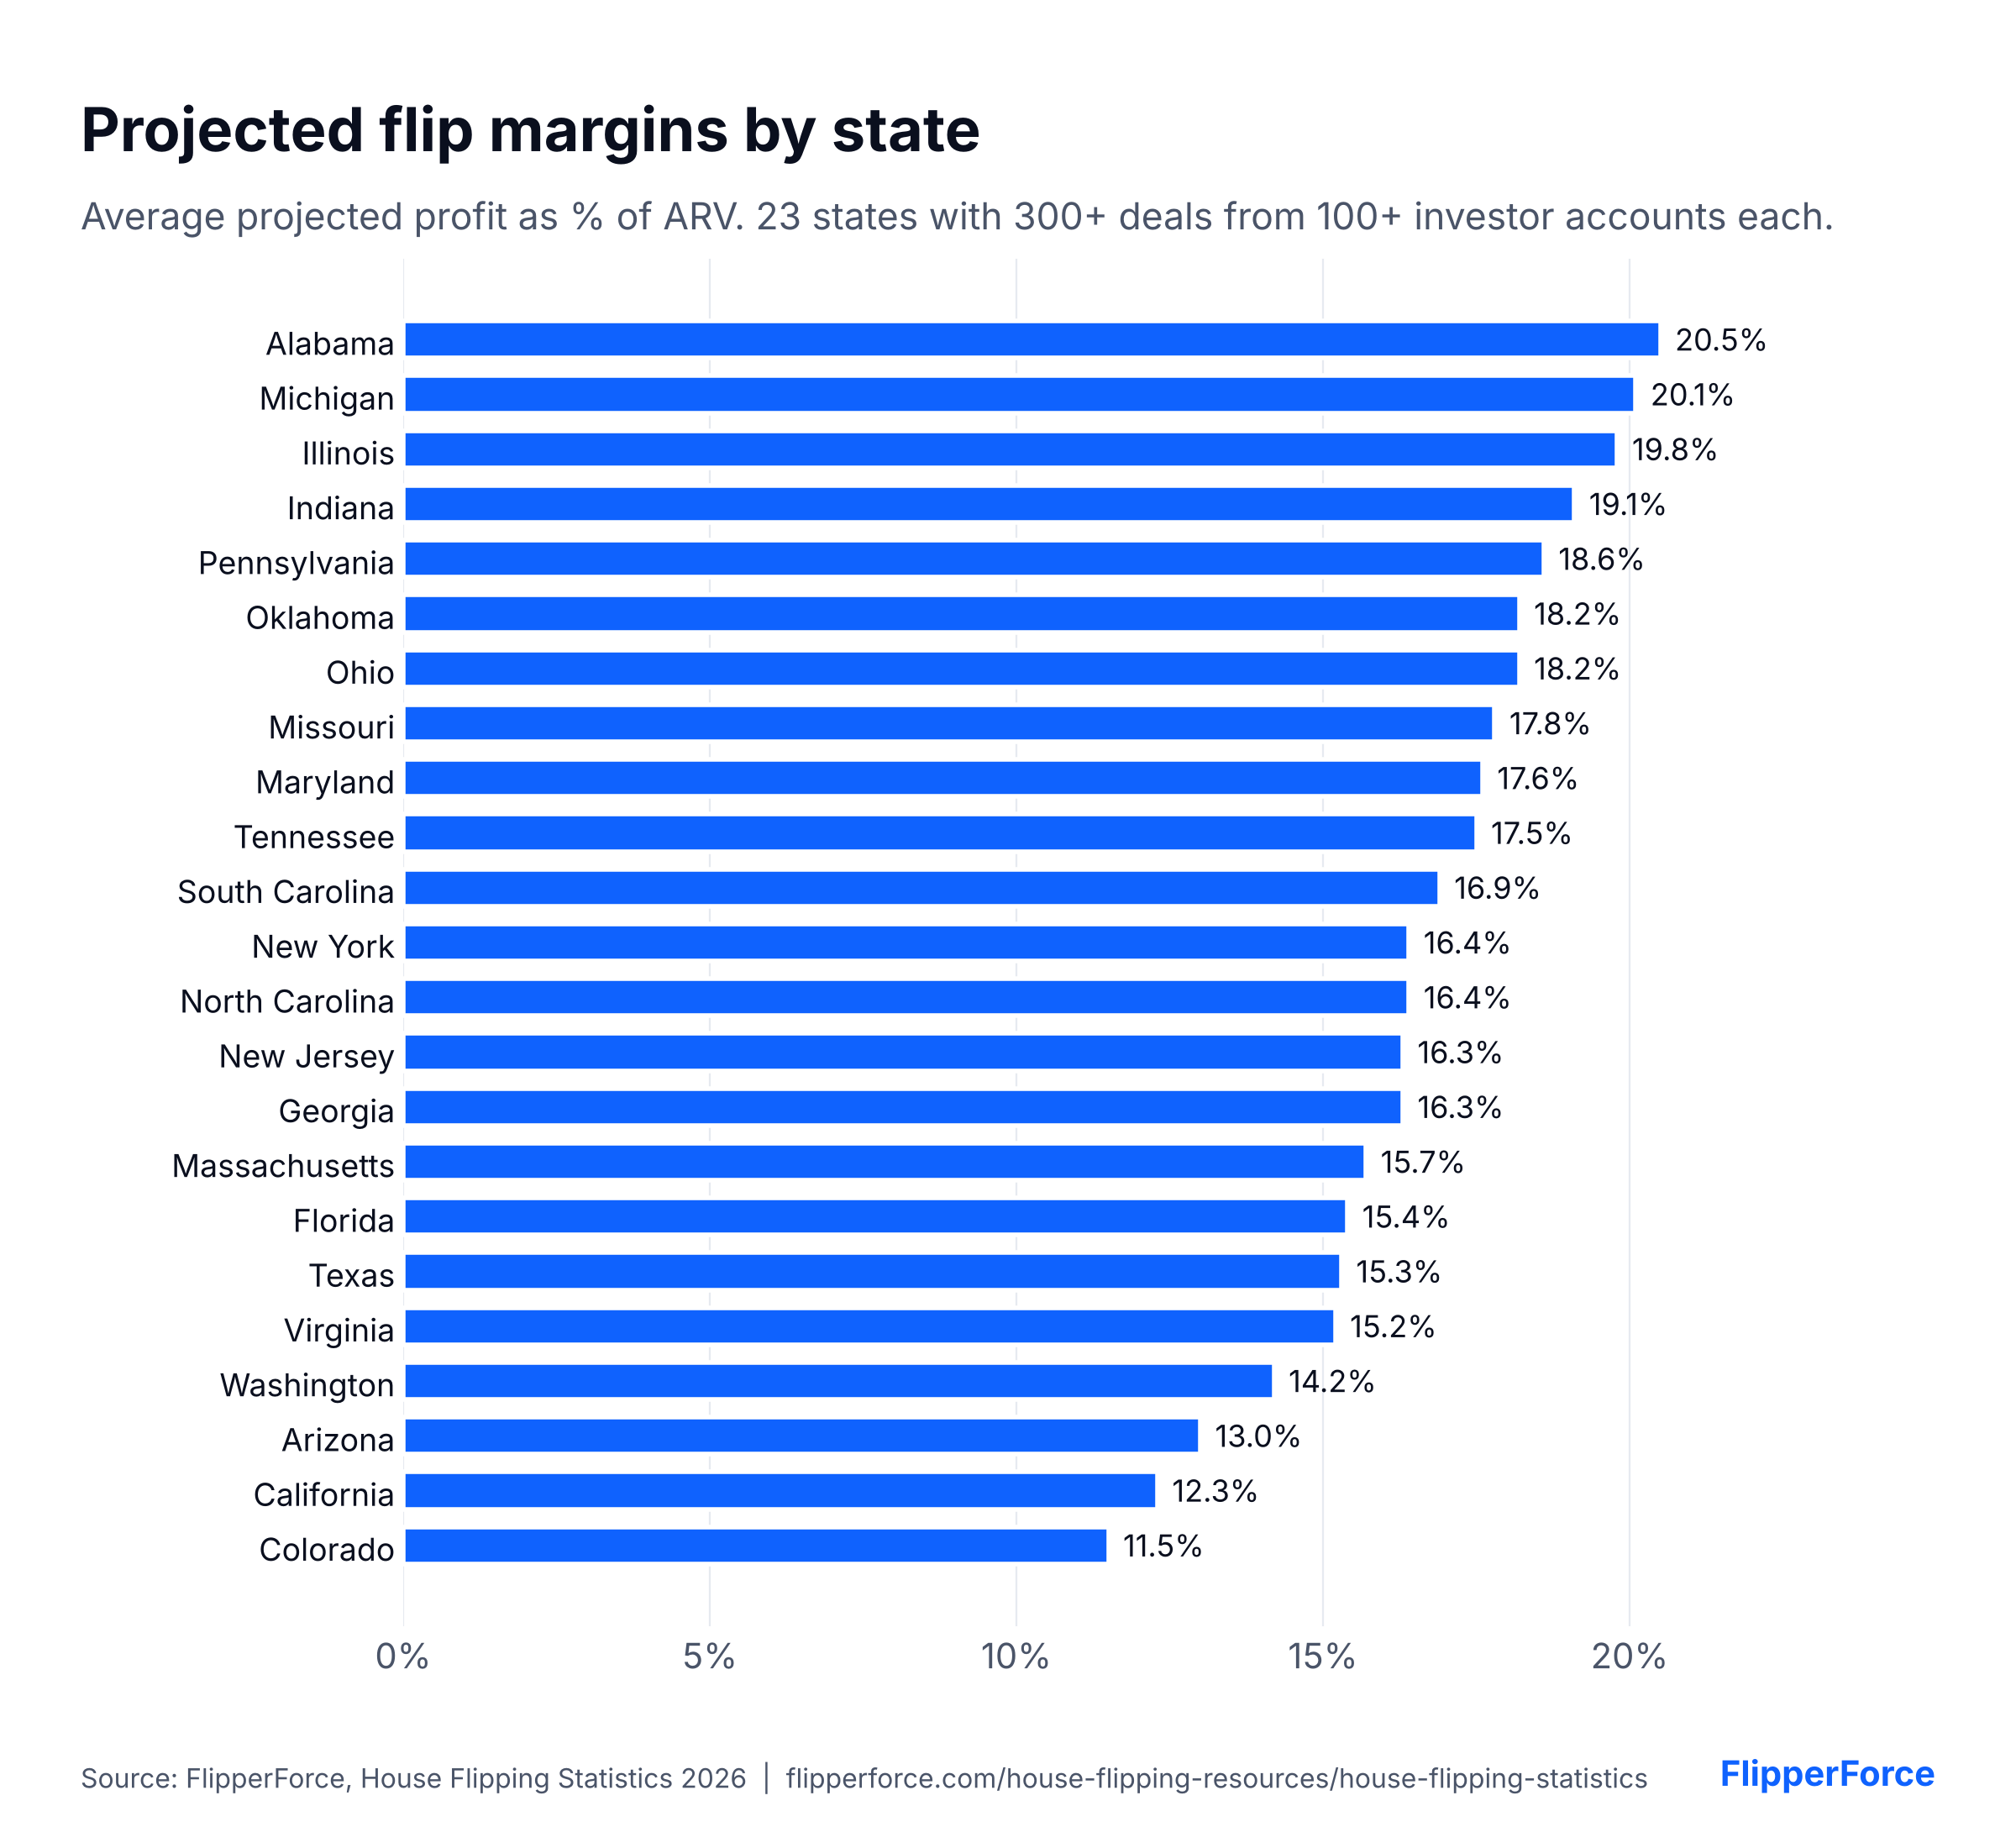
Source: FlipperForce analysis of fix-and-flip deals underwritten on the platform, 2018 to 2026. States with fewer than 300 qualifying deals or 100 investor accounts are not shown.
Methodology
Source: Anonymized, aggregated project data from FlipperForce, a house flipping software platform used by real estate investors since 2018. No individual investor, property, or address is identified.
Sample selection: FlipperForce hosts more than 100,000 projects across flips, rentals, BRRRR deals, wholesales, and new construction. We did not use all of them. Each benchmark draws only on projects with complete, internally consistent data for that metric, which is why sample sizes differ by section. Leads with placeholder numbers, unfinished analyses, and projects without tracked expenses were excluded.
No single account dominates: Large teams can enter hundreds of deals with the same template. To keep any one account from skewing the results, each account contributes at most 10 deals per half-year to every benchmark on this page.
Underwriting benchmarks (25,119 deals from 8,092 investor accounts): Fix-and-flip projects created between 2018 and 2026 with an ARV between $50,000 and $15 million, a purchase price above $0, a rehab budget above $5,000, and a positive projected profit. Ratio metrics exclude obvious data-entry errors (for example, buying costs above 15% of price). These figures reflect what investors budgeted, not final closing statements.
Budget vs. actual (2,050 projects from 577 accounts): Completed or listed projects with 10 or more tracked rehab expenses. Tracked rehab spending was compared to the project's repair estimate. Purchase, closing, holding, financing, and selling expenses were excluded. Projects where tracked spend was under 50% or over 300% of the estimate were excluded as incomplete or mis-entered.
Hold time (1,921 projects from 989 accounts): Fix-and-flip projects with a recorded purchase date and sale date between 1 month and 3 years apart.
Trends: Deals are grouped by the year (or half-year) they were analyzed in FlipperForce, not the year they sold. 2026 is year to date through early October. Seller concessions and commissions come from deals where investors itemized their selling costs.
Statistics: Medians and middle-50% ranges unless labeled as averages.
Updated: October 2026. We plan to refresh these benchmarks annually.
How Use and Cite This Data:
How to use this Data: All charts and statistics on this page are free to use in articles, reports, and presentations, as long as you credit FlipperForce and link to this page. Each chart has an Embed button with ready-made code.
How to cite: FlipperForce, "House Flipping Statistics 2026," flipperforce.com/house-flipping-resources/house-flipping-statistics.
FAQs
What percentage of the purchase price are closing costs on a flip? The median house flipper budgets 2.0% of the purchase price for buying costs, based on 20,837 deals analyzed in FlipperForce. Half of investors budget between 1.1% and 3.1%, or about $1,900 to $7,500 per deal.
What percentage of ARV should I budget for selling costs? The median investor budgets 5.9% of ARV for selling costs, with half budgeting between 4.0% and 7.0%, based on 22,524 deals analyzed in FlipperForce.
How much does a house flip rehab cost per square foot? The median rehab budget is $39 per square foot, based on 17,715 deals analyzed in FlipperForce. By state, medians range from $29 per square foot in Oklahoma and $30 in Texas to $60 in California and $79 in Massachusetts.
What is the average profit on a house flip? The median fix-and-flip deal projects $45,100 in profit and a 13.9% margin on ARV, based on 25,119 deals analyzed in FlipperForce.
How often do house flips go over budget? Among completed rehabs with fully tracked expenses in FlipperForce (2,050 projects), 64.9% finished over the repair estimate and 29.8% went over by 25% or more. The average overrun on over-budget projects was $37,466.
How long does it take to flip a house? The median completed flip took 4.1 months from purchase to sale, based on 1,921 flips in FlipperForce. Half took between 2.9 and 6.0 months.
Have house flipping rehab costs gone up? Yes. The median rehab budget per square foot rose 39%, from $30 in 2020 to $42 in 2026, based on deals analyzed in FlipperForce. Most of the increase happened between 2020 and 2023.
Are house flipping profit margins going down? Yes. The median projected margin fell from 15.9% of ARV in 2020 to 12.7% in 2026, based on deals analyzed in FlipperForce, as rehab and selling costs rose while median ARVs leveled off near $350,000 to $370,000 after 2022.
Have selling costs gone down since the NAR settlement? No. Average selling costs that investors budget in FlipperForce held near 5.5% of ARV after the August 2024 NAR settlement changes, then rose to 5.99% so far in the second half of 2026. Seller concessions grew more common and larger in late 2025 and early 2026, and budgeted commissions edged back up.
Ready to Take Action?
Sign up for a free trial and join over 3,000 house flippers and real estate investors that have taken their business to the next level!