We're thrilled to announce the launch of major improvements to the Accounting Dashboard which brings you a more focused and informative way to visualize the financial health of your projects, from active renovations to completed flips and long-term rentals.
Consolidated Financial Overview in One Place
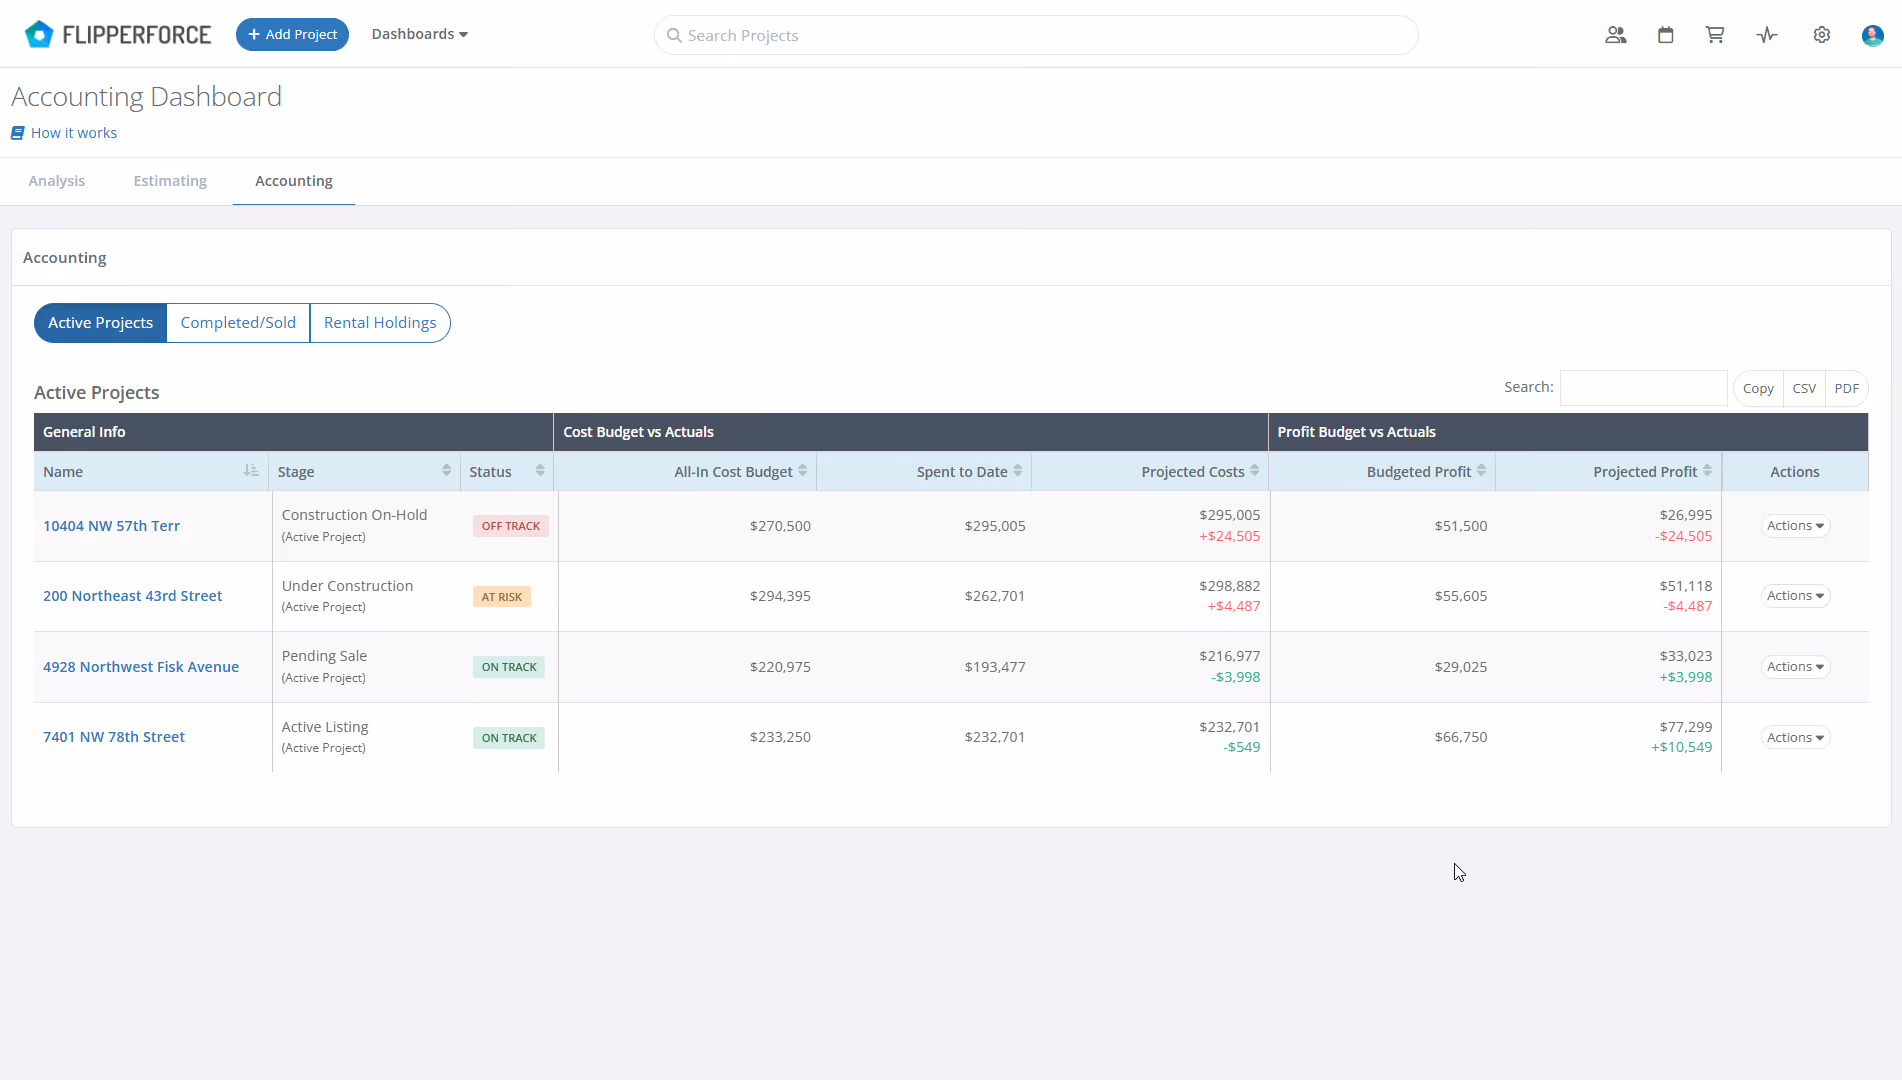
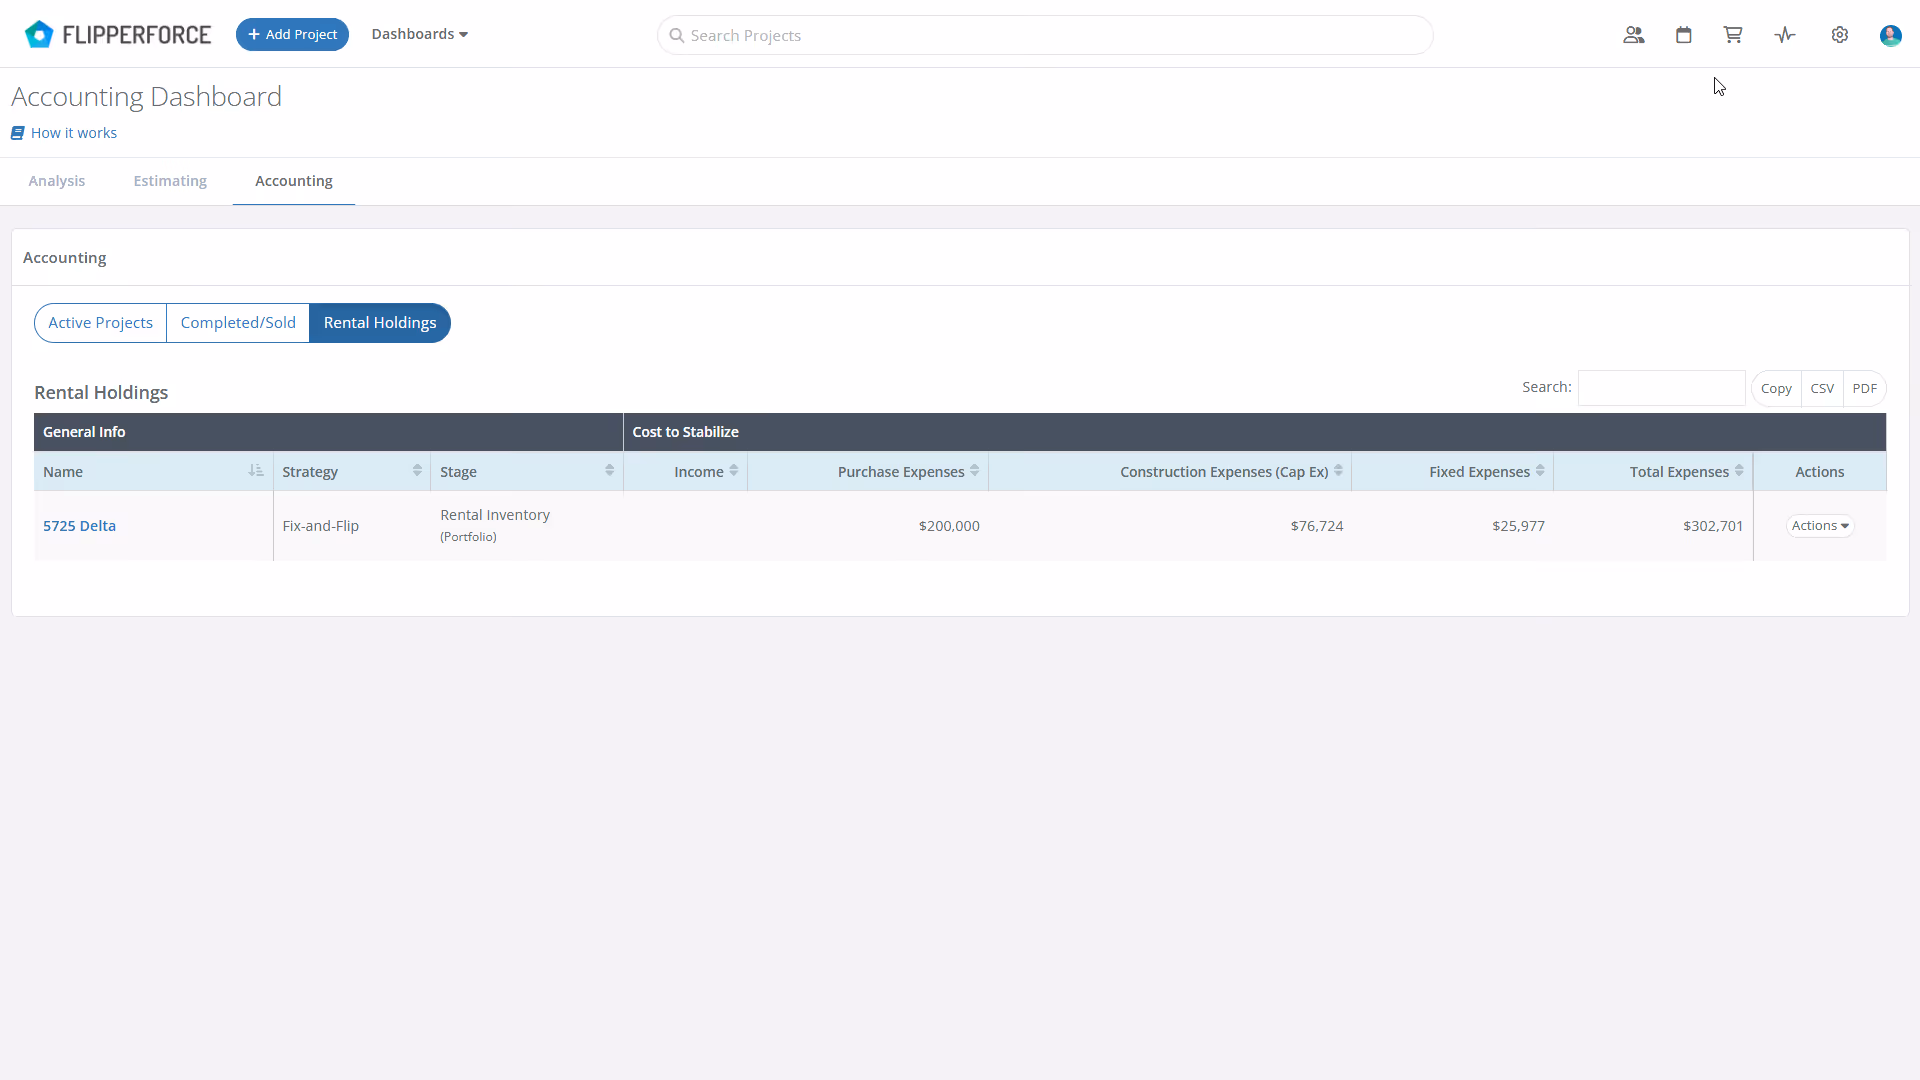
The redesigned Accounting Dashboard provides a consolidated view of your budgets and expenses across all your projects, whether they're actively under construction, successfully completed, or long-term rentals.
Active Projects Table
Compare your budgeted costs with actual spending to identify potential overages and keep your projects on track.
See the forecasted impact on your profit margin, allowing you to make informed budget adjustments.
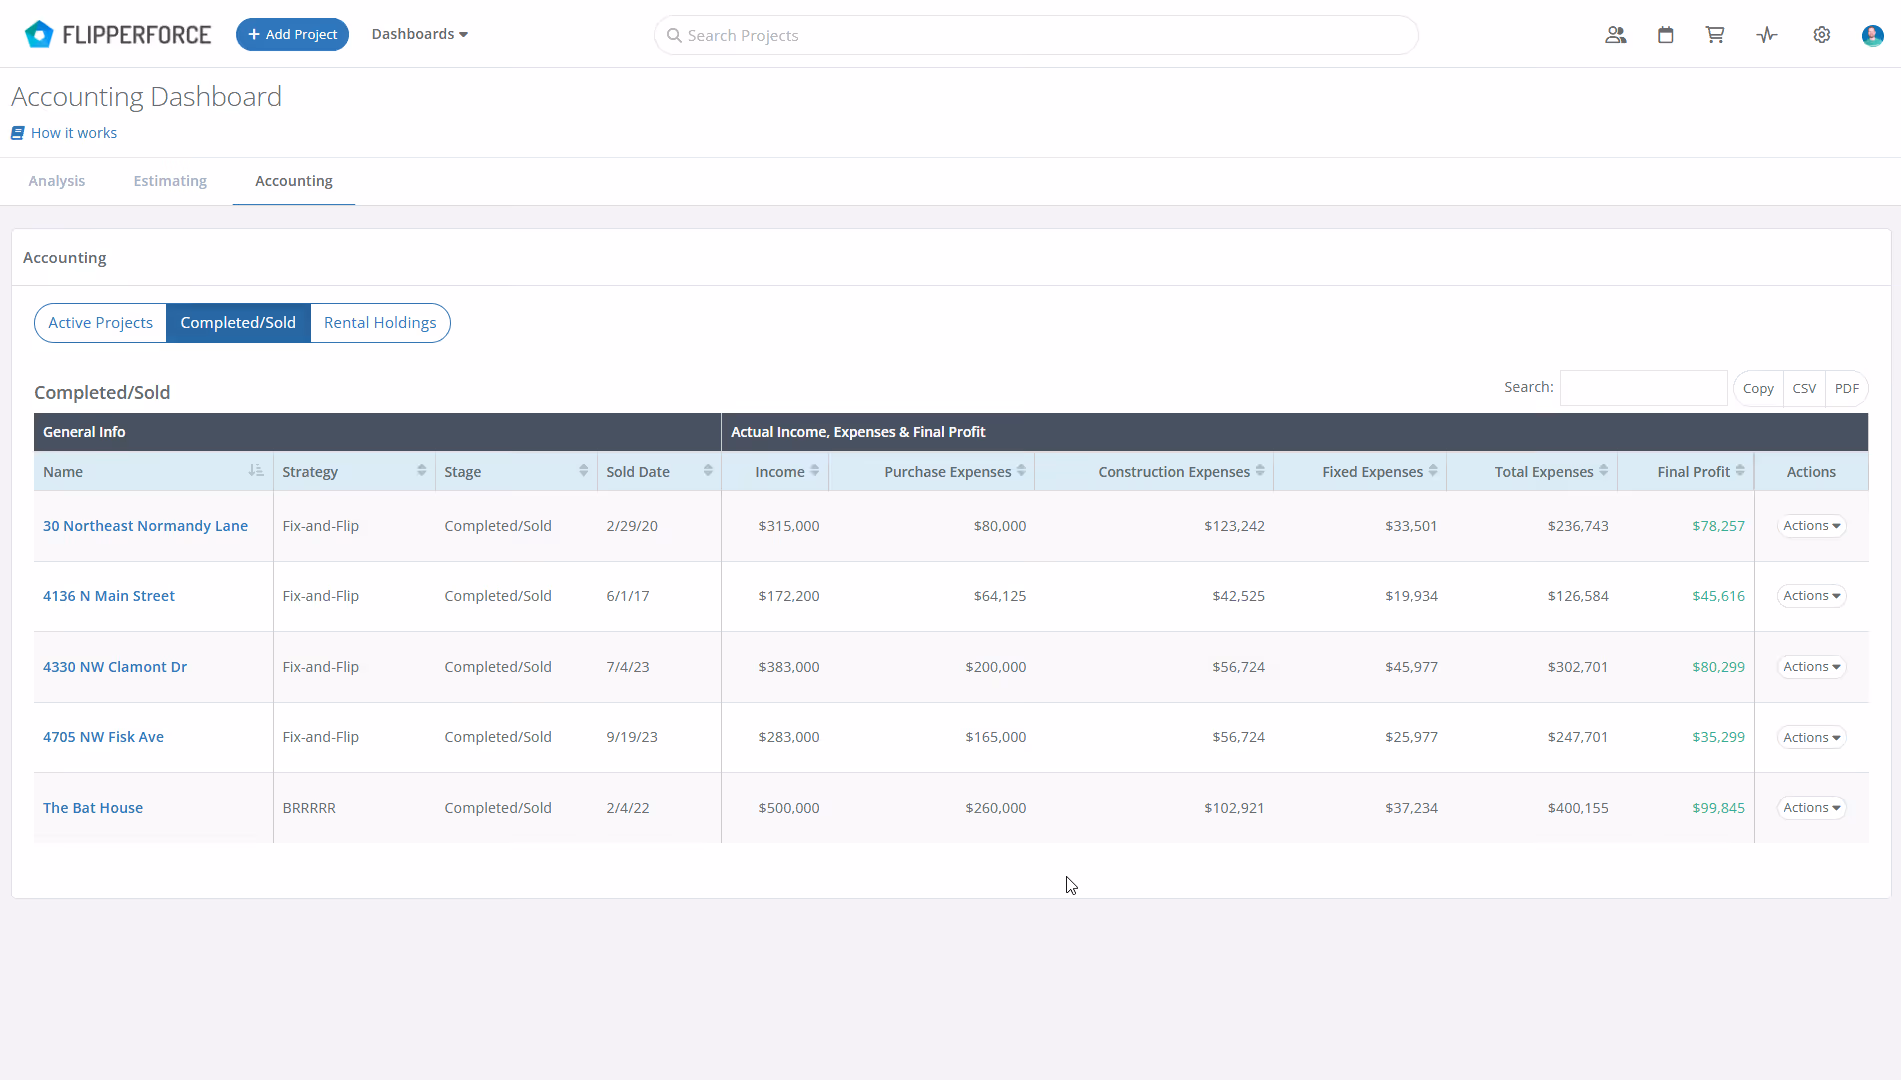
Completed/Sold Table
Gain valuable insights into the final profitability of your completed projects.
Easily access income, expenses, and final profit figures for tax purposes.
Rental Holdings Table
Track the cost basis of your rental properties.
Understand how much you've invested in getting them up and running.
Export for Further Analysis:
Need the data in another format? No problem! Every table allows you to export information to a CSV spreadsheet or copy it to your clipboard.
Run custom reports, filter data by specific criteria, or integrate it with your favorite financial software for deeper analysis.
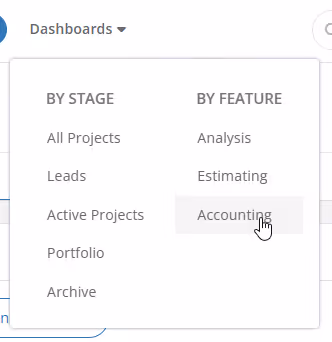
To access the Accounting Dashboard, navigate to the "Dashboards" dropdown menu in the top navigation bar, under "By Feature."
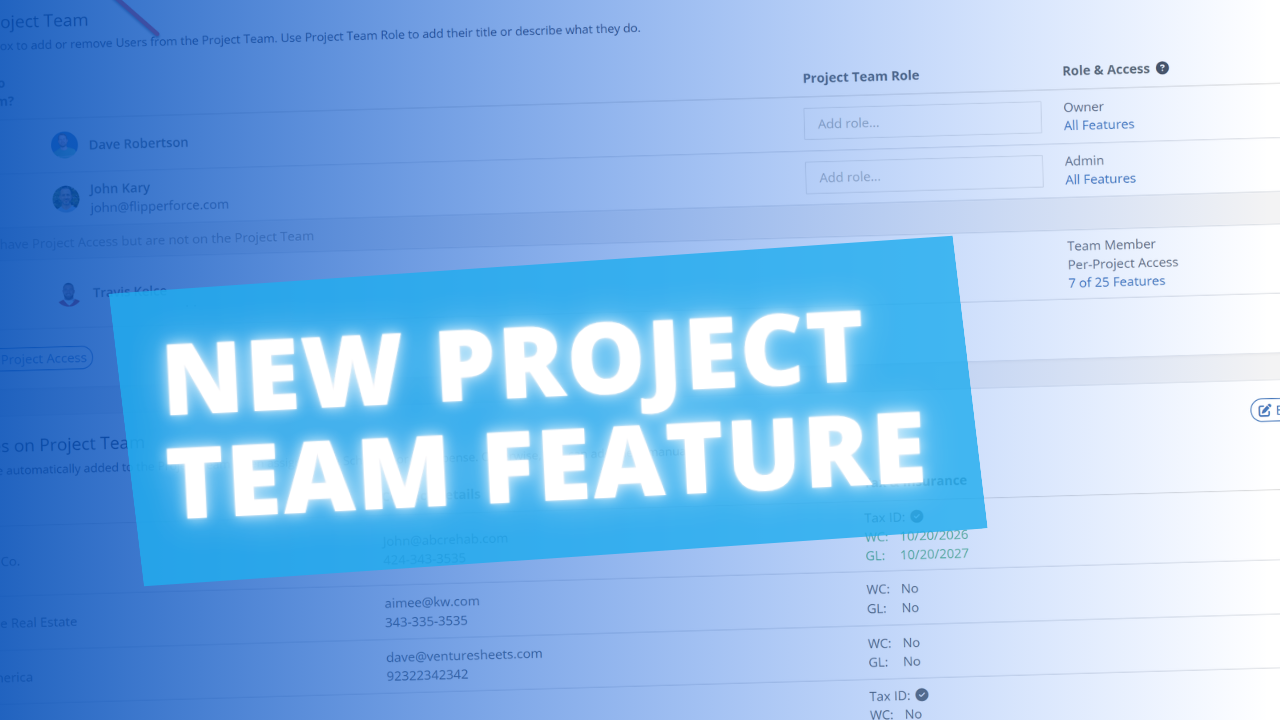
Learn how the new Project Team feature automatically tracks your internal team members and companies on every flip, so you always know who's managing the project and how to reach them.
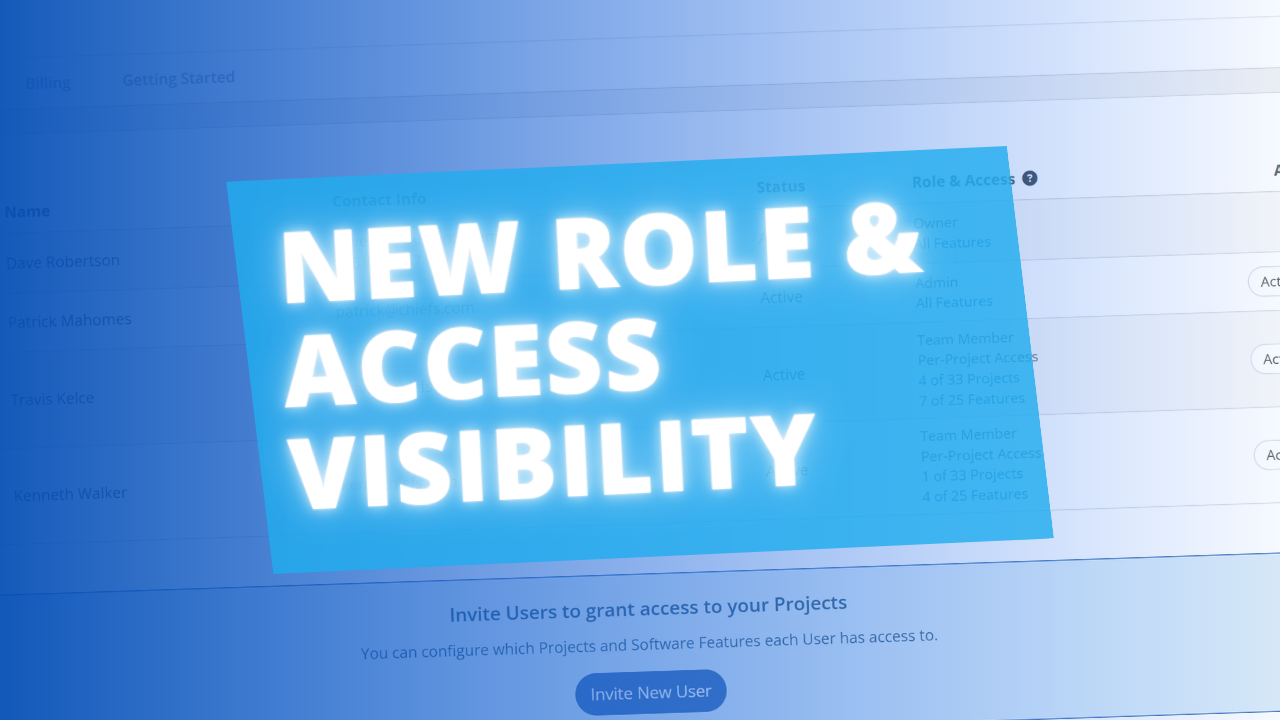
User Management now includes a Role & Access column, giving workspace owners and admins instant visibility into each user's project and feature access without having to dig into individual settings.
Thumbs up to select your best comps, thumbs down to push the bad ones to the bottom — keeping your list clean and your Comps Report focused on the properties that actually matter.
Our new Public API update allows developers and custom AI tools to securely connect to the FlipperForce Expense Tracker to automate data entry, feed custom dashboards, and sync project financial records directly from external business apps.
Tax & Insurance column added to Companies & Contacts, giving you instant visibility into W-9 status and color-coded Workers Comp and General Liability expiration dates for every contractor in your workspace at a glance.
Our newly revamped Property Data and Owner Data pages feature a clean, highly legible layout along with a brand-new, completely editable Seller Motivation Matrix to help you seamlessly track and document critical lead details and distress signals.


.png)