We're excited to announce the launch of two powerful new features designed to streamline your workflow and empower informed decisions: Map views and Table views across all your Project Dashboards!

New Map Views!

Imagine having a bird's-eye view of your entire real estate operation. With our newly launched map views across all Project Dashboards, that vision becomes a reality!

Main Project Dashboard Map View

On our Main Project Dashboard we added a new map view that shows all your projects, including Leads, Active Projects and Completed Flips, plotted on a map. This overall map view will help you Identify areas with high project concentration, helping you strategize future investments and optimize your growing portfolio.

image

Leads, Active Projects & Portfolio Map Views

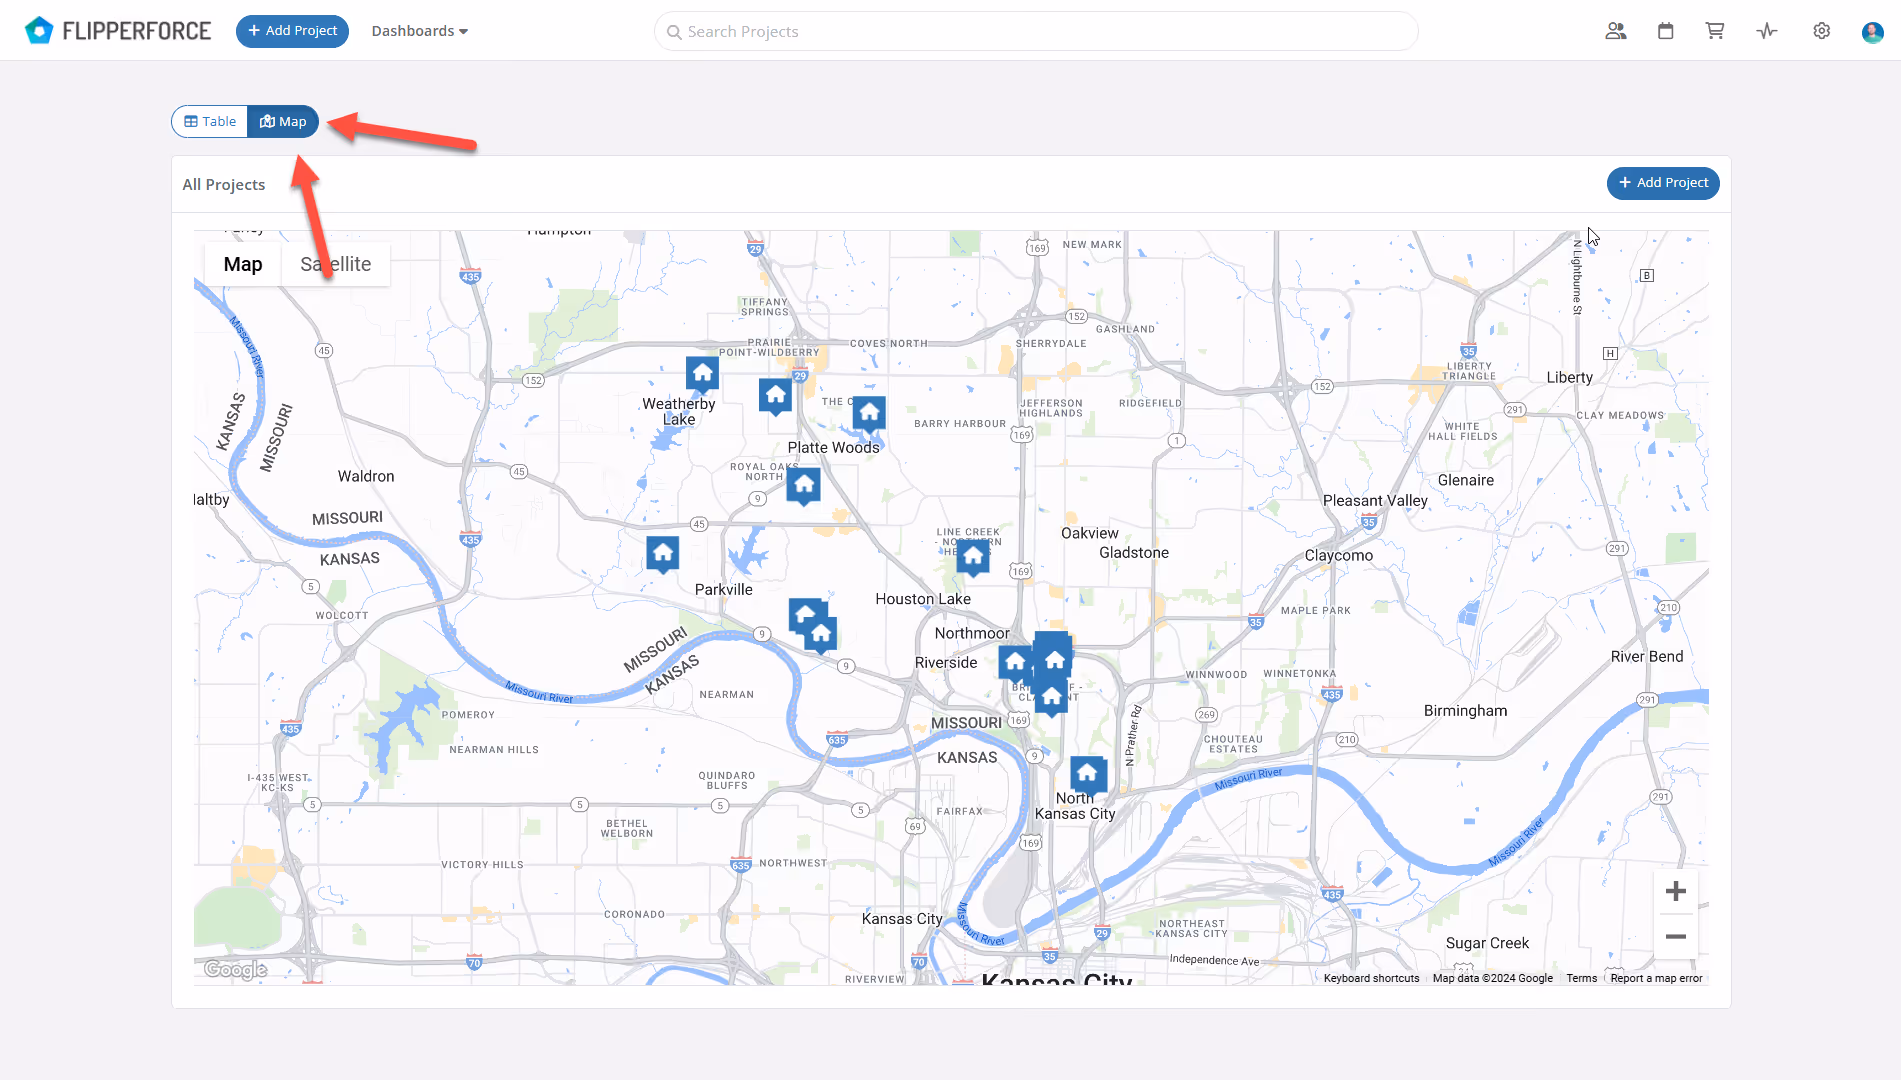
Each Project Dashboard (Leads, Active Projects, Portfolio) also now includes a map view alongside the Pipeline & Table view options.

image

Enhanced Data Insights with Table Views

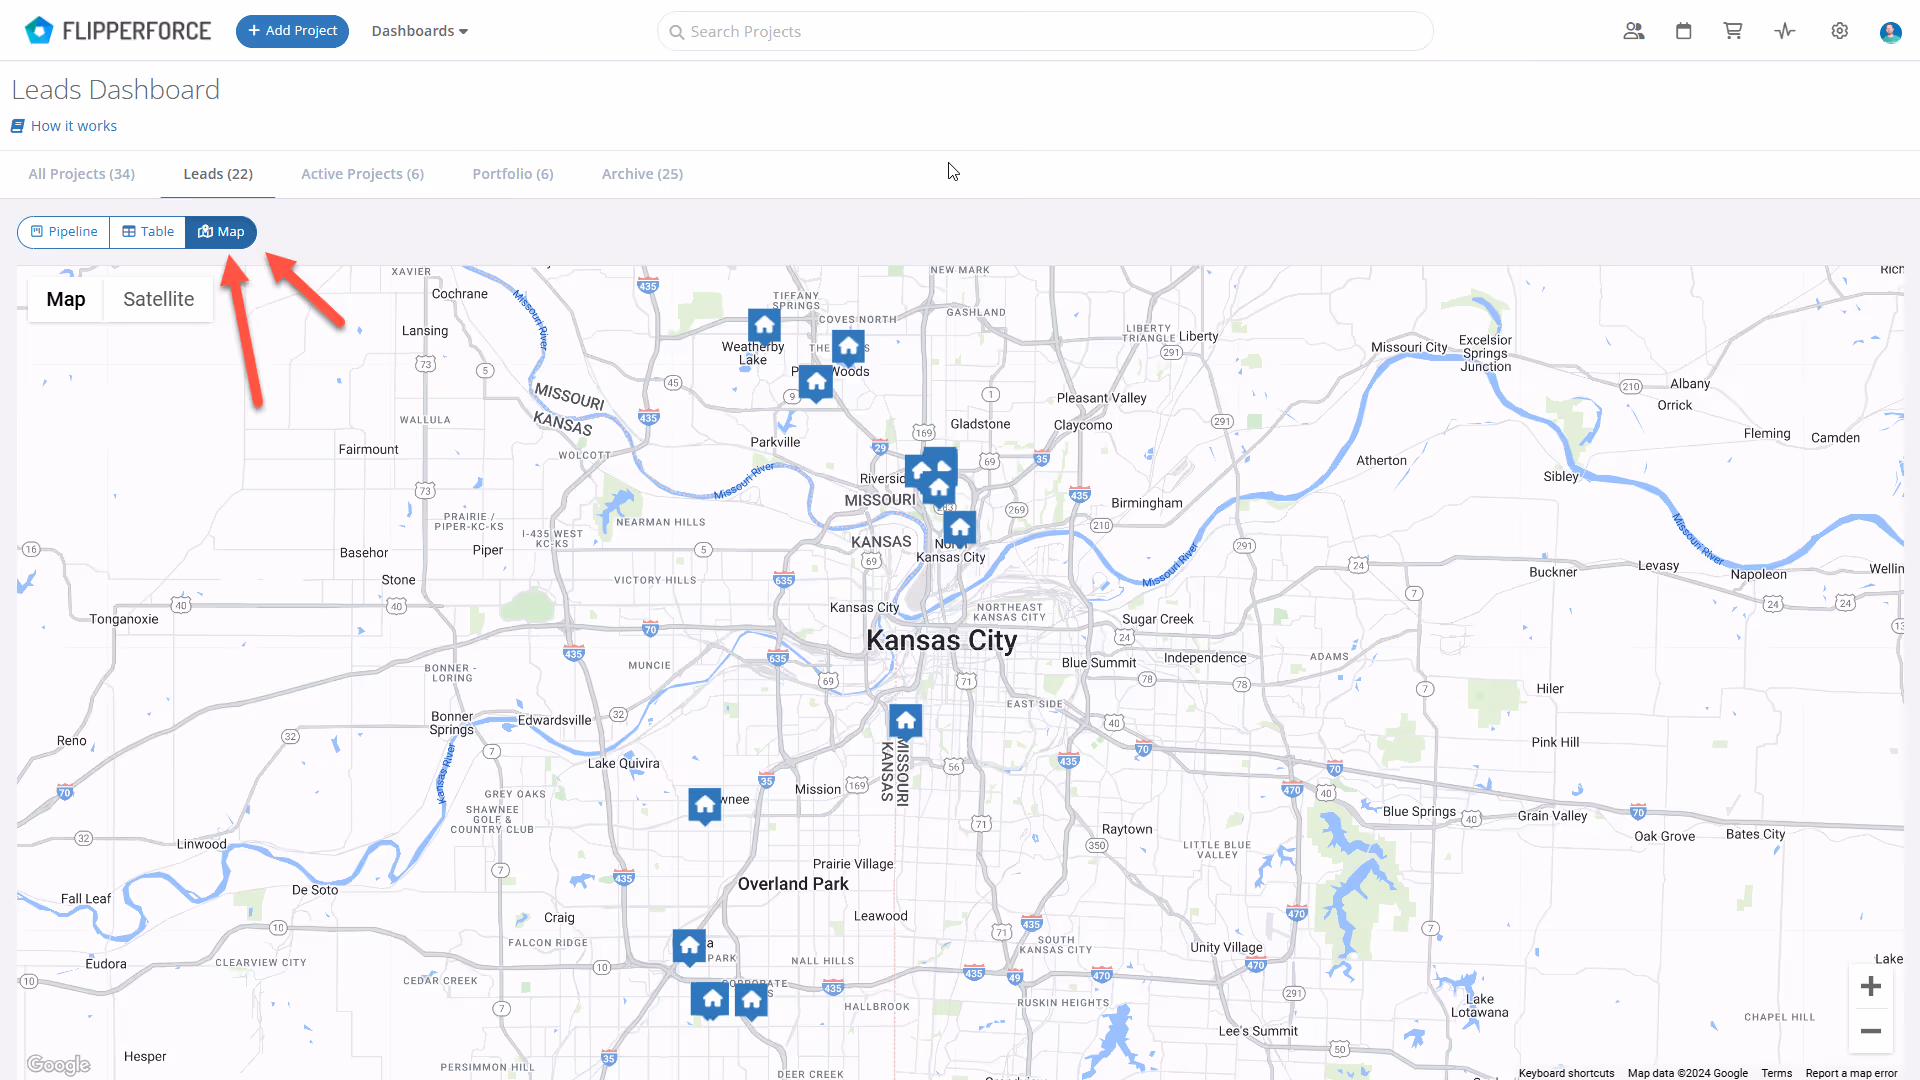
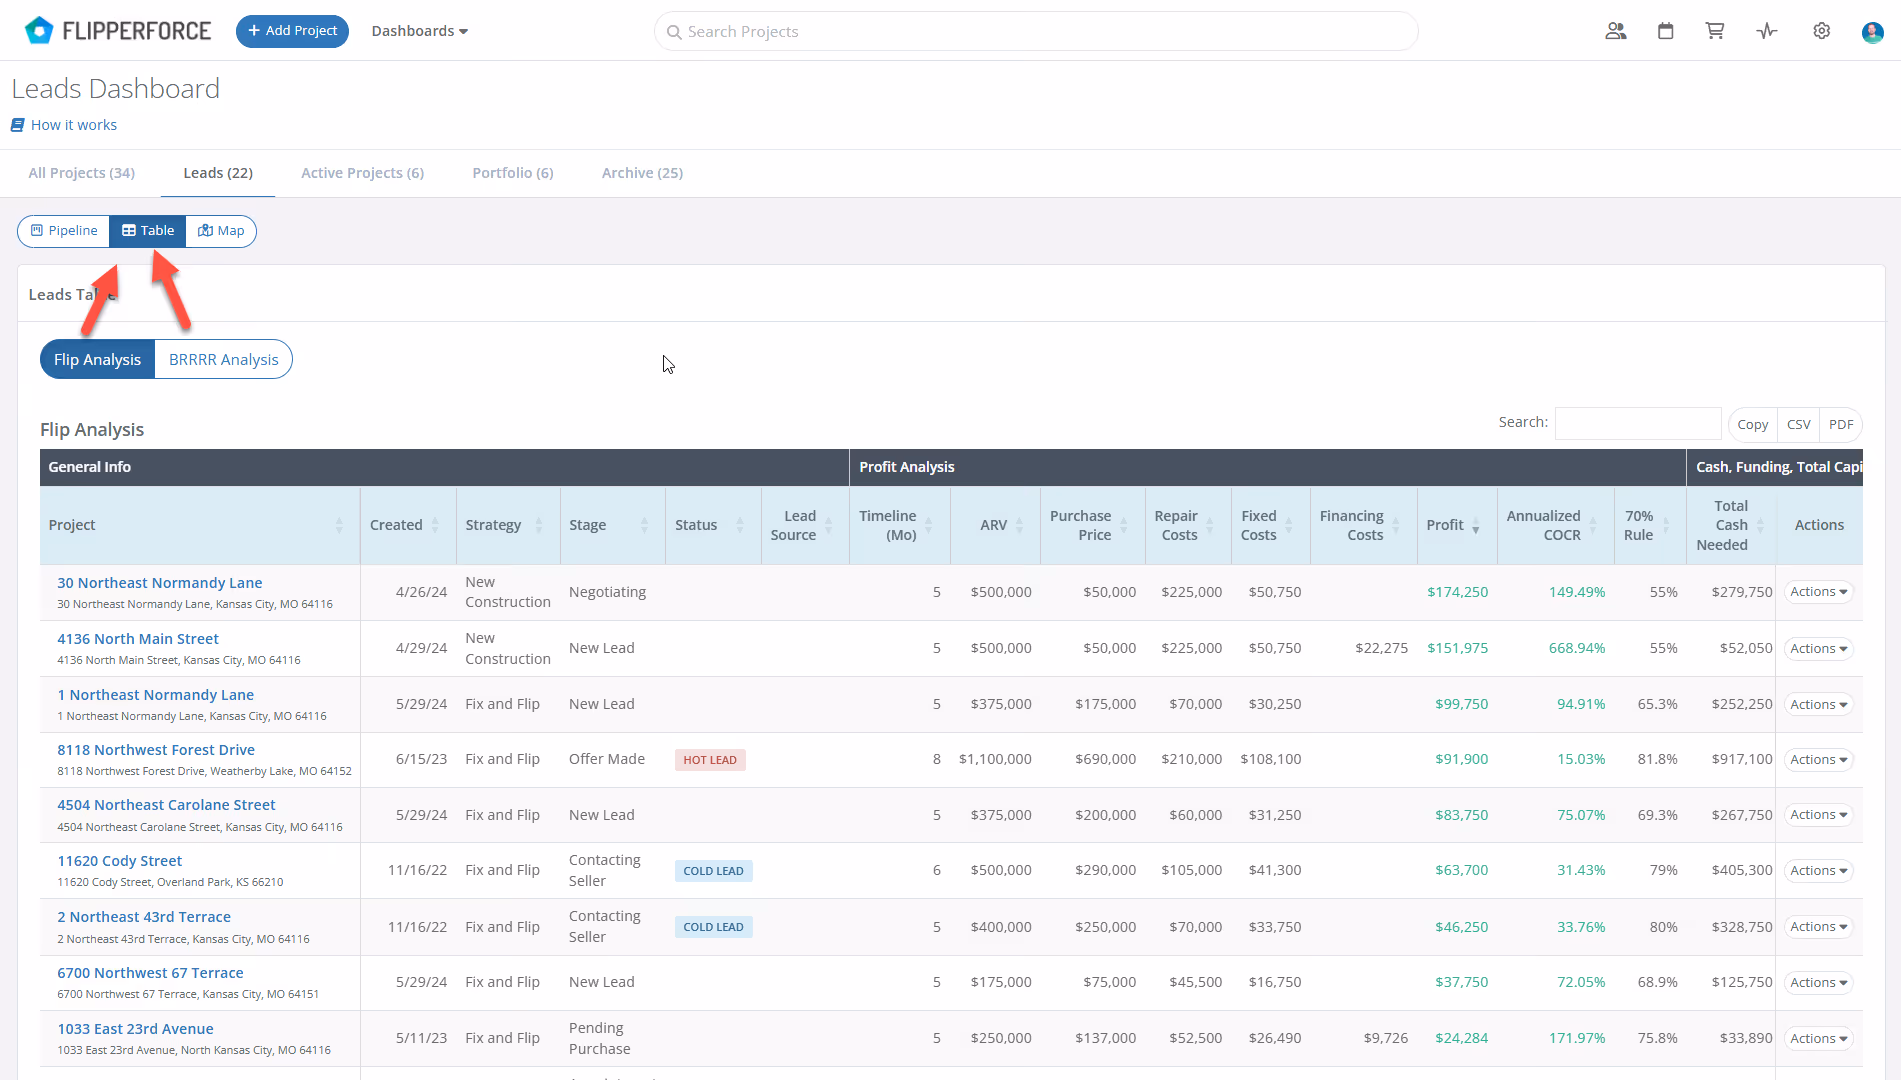
The Map view provides a high-level picture, but we know you also crave the details, so we added new Table views to all of our Dashboards that provide the most important datapoints for each stage of your projects.

Leads Dashboard

The Leads Dashboard Table view provides an overall view of the financial analysis for every Lead you have in your pipeline. The Lead Table view focuses on the financial datapoints like ARV, purchase price, renovation costs, and projected profit so you compare profitaiblity of your opportunities side-by-side. This table also shows how much Cash and Funding you will need for each deal so you can plan how much capital you need to raise for your deals.

image

Active Projects Dashboard

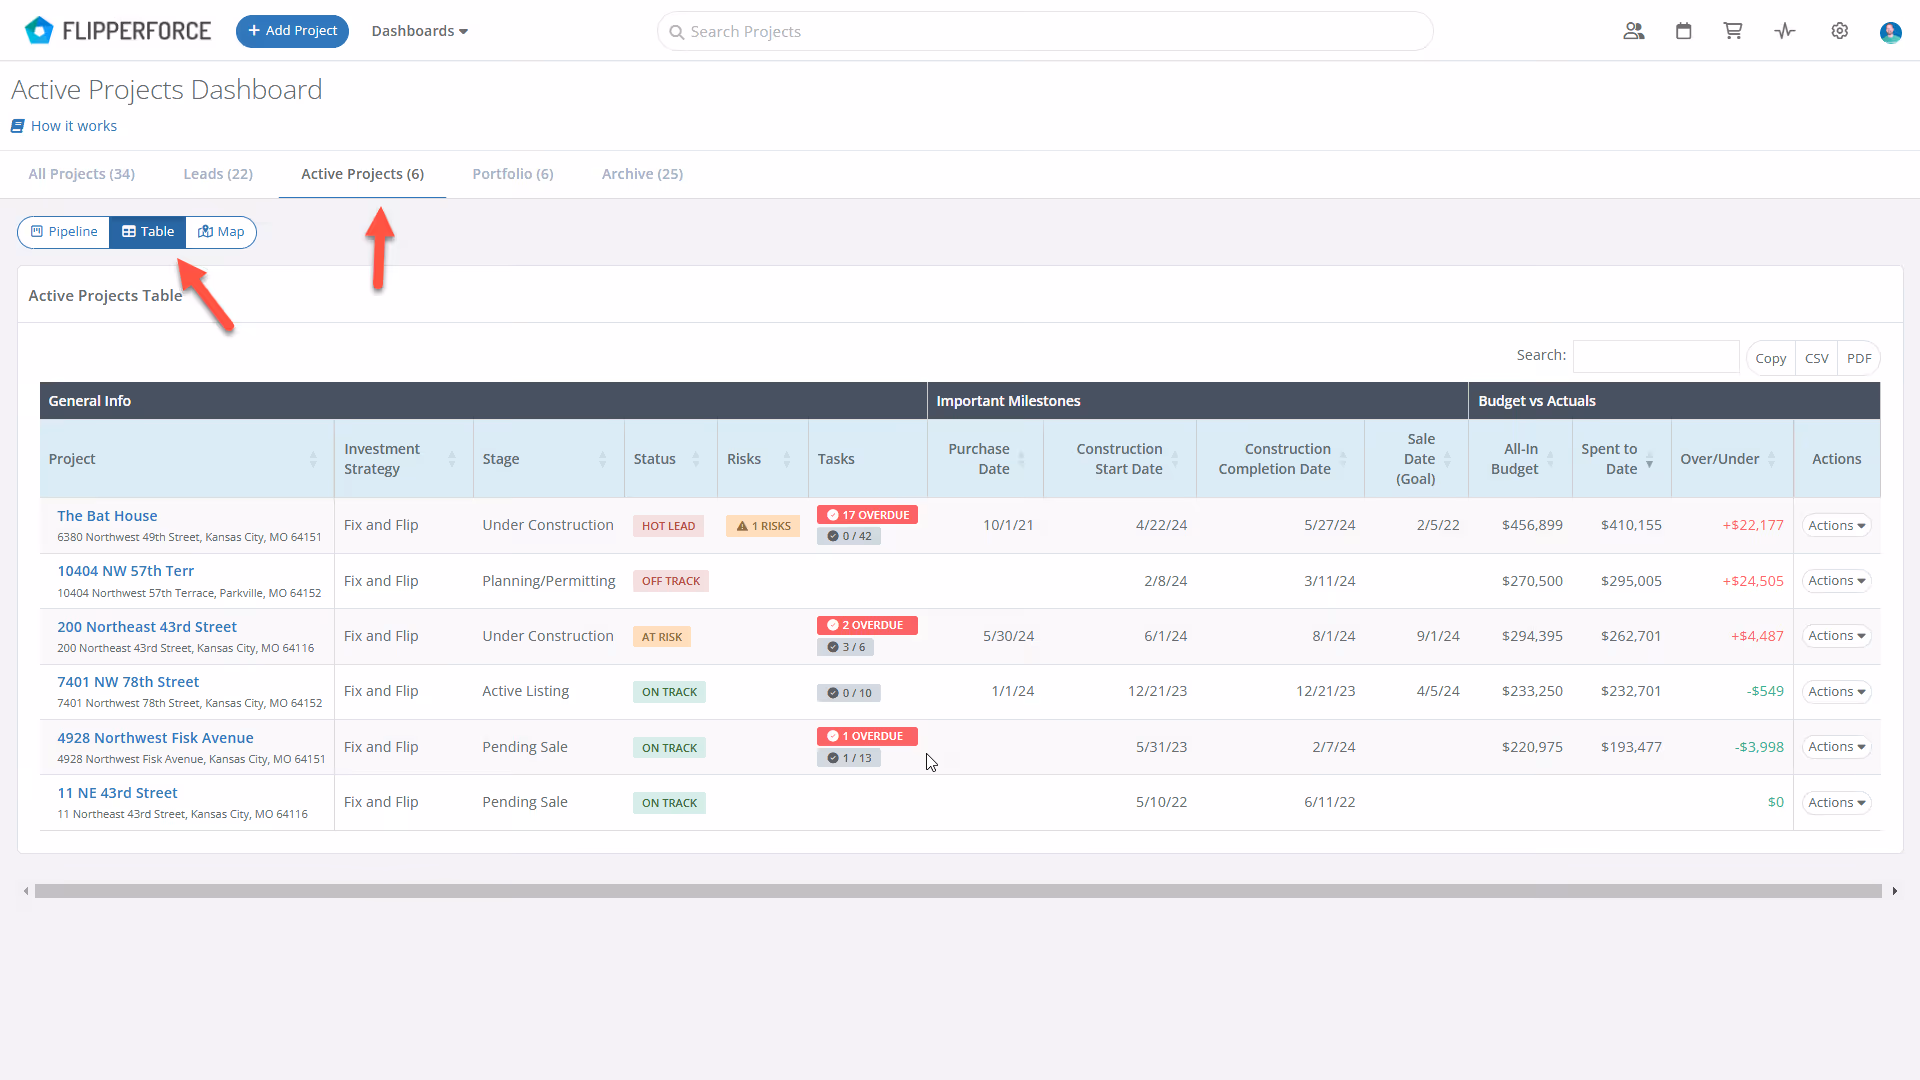
The Active Projects Tablie view provides an overall view of all of project milestones, budget vs. actuals, and potential risks for your Active Projects. The table displays purchase date, construction start and completion targets, and your sales goals. Track spending with the "Spent to Date" column and identify variances from your budget.

image

Portfolio Dashboard

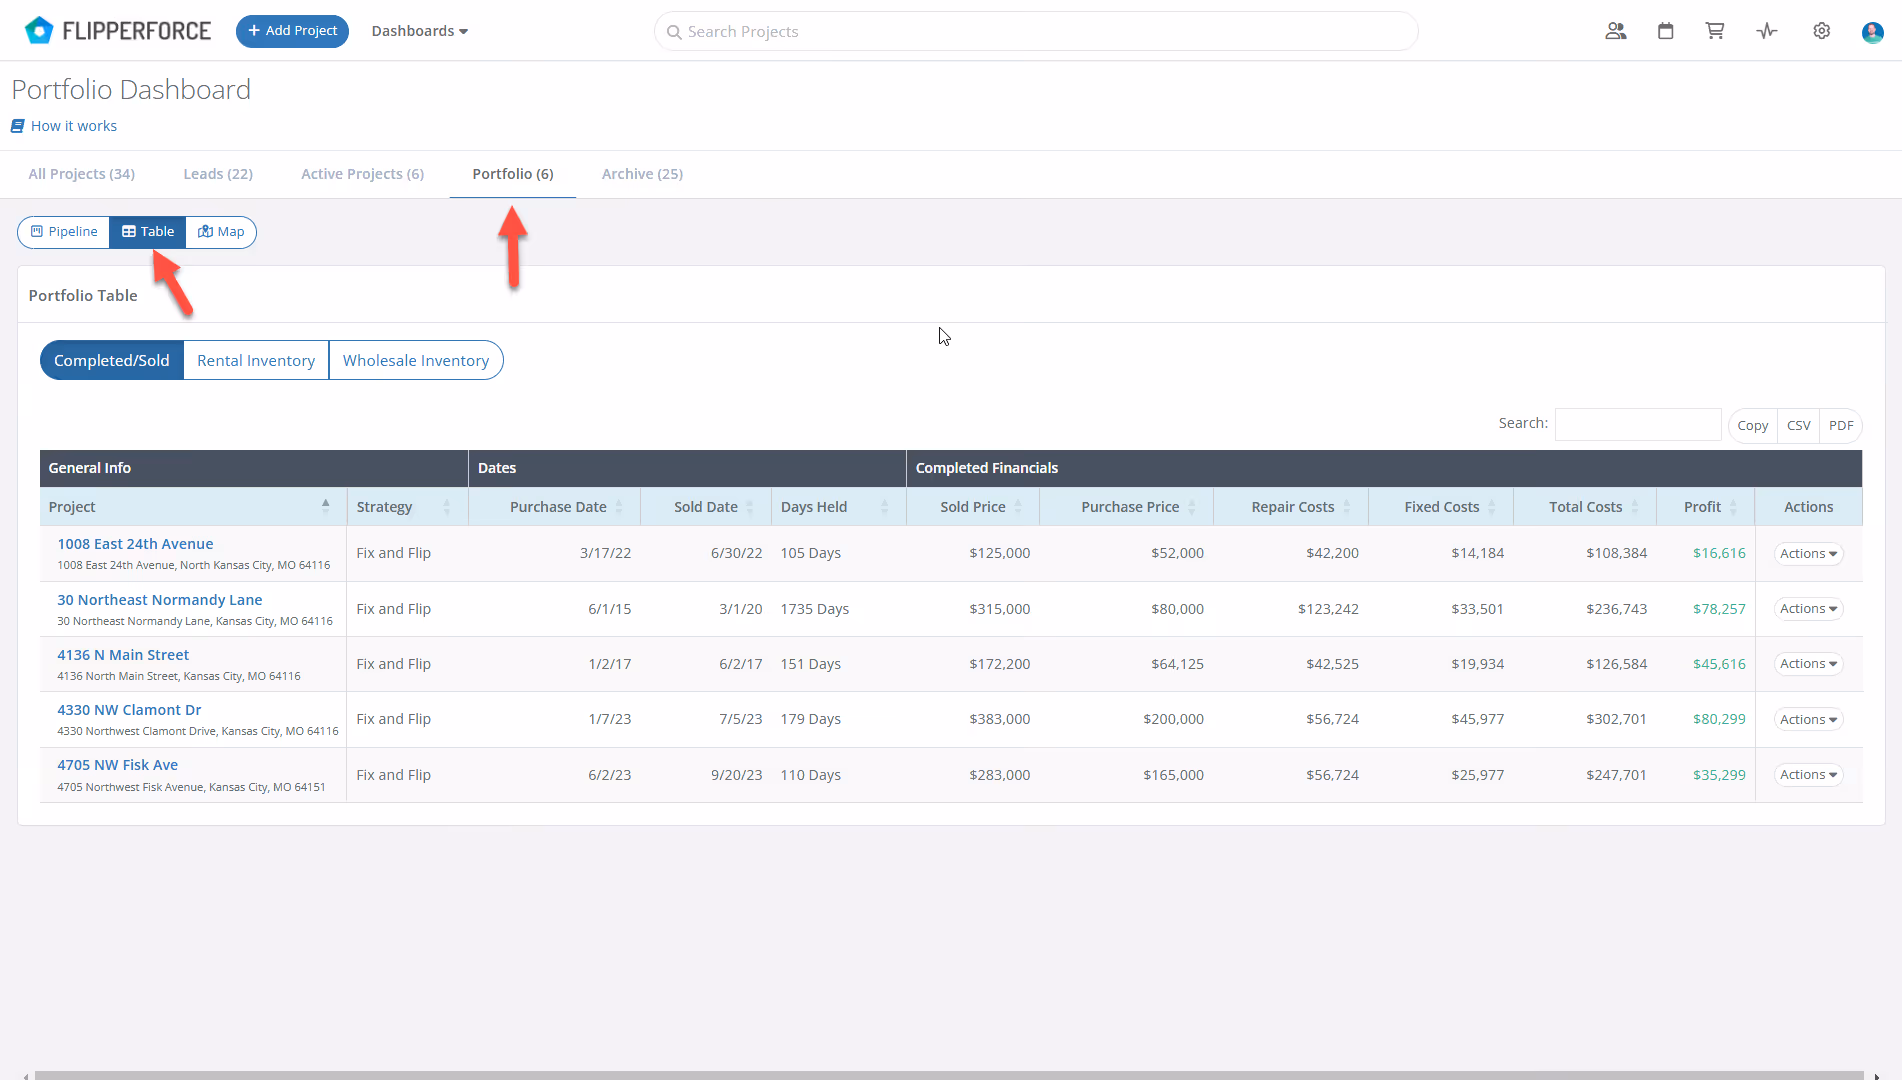
Analyze the performance of your Completed Projects with ease. See buy and sell dates alongside final financial results. The table showcases the final sale price, your renovation and holding costs, and calculates your total profit. We've even included dedicated tables for rental and wholesale holdings, providing valuable insights for your entire Portfolio.

image

Dave Robertson
May 29, 2024
5 min read
Our blog

Other Recent Blog Posts

New Features

New Public API Endpoints for Expenses

Our new Public API update allows developers and custom AI tools to securely connect to the FlipperForce Expense Tracker to automate data entry, feed custom dashboards, and sync project financial records directly from external business apps.
Dave Robertson
June 21, 2026
5 min read
New Features

Companies & Contacts: Tax & Insurance Status at a Glance

Tax & Insurance column added to Companies & Contacts, giving you instant visibility into W-9 status and color-coded Workers Comp and General Liability expiration dates for every contractor in your workspace at a glance.
Dave Robertson
June 11, 2026
5 min read
New Features

Property and Owner Data Revamp

Our newly revamped Property Data and Owner Data pages feature a clean, highly legible layout along with a brand-new, completely editable Seller Motivation Matrix to help you seamlessly track and document critical lead details and distress signals.
Dave Robertson
May 27, 2026
5 min read
New Features

Project Overview Revamp for Improved Organization and Clarity

Manage your entire project from one centralized "Command Center" that combines settings, status tracking, and critical tools into a single, high-clarity view.
Dave Robertson
May 12, 2026
5 min read
New Features

New % of Cost Desired Profit Calculation

You can now calculate your Desired Profit based on a % of Total Project Costs in the Flip Analyzer and save it as a global default in your settings for faster, ROI-driven deal analysis.
Dave Robertson
April 27, 2026
5 min read
New Features

Bulk Import Your Home Depot Purchase History

Stop wasting hours on manual data entry by using the FlipperForce AI-powered importer to instantly transform your Home Depot purchase history into a fully categorized, real-time look at your budget vs. actuals.
Dave Robertson
April 13, 2026
5 min read

Ready to Take Action?

Sign up for a free trial and join over 3,000 house flippers and real estate investors that have taken their business to the next level!